Electronic Arts 2013 Annual Report Download - page 39
Download and view the complete annual report
Please find page 39 of the 2013 Electronic Arts annual report below. You can navigate through the pages in the report by either clicking on the pages listed below, or by using the keyword search tool below to find specific information within the annual report.-
 1
1 -
2
-
3
-
4
-
5
-
6
-
7
-
8
-
9
-
10
-
11
-
12
-
13
-
14
-
15
-
16
-
17
-
18
-
19
-
20
-
21
-
22
-
23
-
24
-
25
-
26
-
27
-
28
-
 29
29 -
 30
30 -
 31
31 -
 32
32 -
 33
33 -
 34
34 -
 35
35 -
 36
36 -
 37
37 -
 38
38 -
 39
39 -
 40
40 -
 41
41 -
 42
42 -
 43
43 -
 44
44 -
 45
45 -
 46
46 -
 47
47 -
 48
48 -
 49
49 -
50
-
51
-
52
-
53
-
54
-
55
-
56
-
57
-
58
-
59
-
60
-
61
-
62
-
63
-
64
-
65
-
66
-
67
-
68
-
69
-
70
-
71
-
72
-
73
-
74
-
75
-
76
-
77
-
78
-
79
-
80
-
81
-
82
-
83
-
84
-
85
-
86
-
87
-
88
-
89
-
90
-
91
-
92
-
93
-
94
-
95
-
96
-
97
-
98
-
99
-
100
-
101
-
102
-
103
-
104
-
105
-
106
-
107
-
108
-
109
-
110
-
111
-
112
-
113
-
114
-
115
-
116
-
117
-
118
-
119
-
120
-
121
-
122
-
123
-
124
-
125
-
126
-
127
-
128
-
129
-
130
-
131
-
132
-
133
-
134
-
135
-
136
-
137
-
138
-
139
-
140
-
141
-
142
-
143
-
144
-
145
-
146
-
147
-
148
-
149
-
150
-
151
-
152
-
153
-
154
-
155
-
156
-
157
-
158
-
159
-
160
-
161
-
162
-
163
-
164
-
165
-
166
-
167
-
168
-
169
-
170
-
171
-
172
-
173
-
174
-
175
-
176
-
177
-
178
-
179
-
180
-
181
-
182
-
183
-
184
-
185
-
186
-
187
-
188
-
189
-
190
-
191
-
192
-
193
-
194
-
195
-
196
-
197
-
198
-
199
-
200
-
201
-
202
-
203
-
204
 |
 |

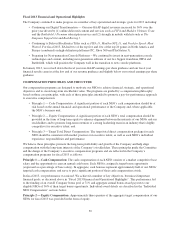
Proxy Statement
Annual Equity Awards
In fiscal 2013, the Committee approved annual equity awards to certain NEOs based on eligibility criteria at the
time of grant. The Board approved all equity awards granted to our former CEO. These awards were targeted as
50% performance-based RSUs and 50% time-based RSUs with a three-year pro rata vesting schedule. We
granted a mix of performance-based RSUs and RSUs to our NEOs to balance pay-for-performance equity
incentives with the retentive value of time-based awards. The number of performance-based RSUs and RSUs
awarded to each NEO was determined by a variety of factors including: role within the Company, individual
performance, the value of unvested equity, the grant date value of the award, actual compensation realized,
market practices, and internal alignment with other executive officers.
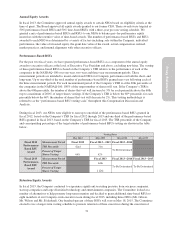
Performance-Based RSUs
For the past two fiscal years, we have granted performance-based RSUs as a component of the annual equity
awards to executive officers at the level of Executive Vice President and above, excluding new hires. The vesting
of these performance-based RSUs is based on the Company’s TSR relative to the performance of each of the
companies in the NASDAQ-100 over one-year, two-year and three-year measurement periods. These
measurement periods are intended to incent and reward NEOs for Company performance in both the short- and
long-term. Up to one-third of the total number of performance-based RSUs granted may vest following each of
the three measurement periods. For each measurement period, if the Company’s TSR is at the 60th percentile of
the companies in the NASDAQ-100, 100% of the target number of shares will vest. If the Company’s TSR is
above the 60th percentile, the number of shares that vest will increase by 3% for each percentile above the 60th
(up to a maximum of 200% of target shares vesting). If the Company’s TSR is below the 60th percentile, for each
percentile below the 60th, the number of shares that vest will decrease by 2%. This vesting methodology is
referred to as the “performance-based RSU vesting scale” throughout this Compensation Discussion and
Analysis.
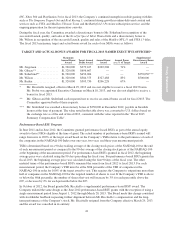
During fiscal 2013, our NEOs were eligible to earn up to one-third of the performance-based RSUs granted in
fiscal 2012, based on the Company’s TSR for fiscal 2012 through 2013 and one-third of the performance-based
RSUs granted in fiscal 2013, based on the Company’s TSR for fiscal 2013. The TSR percentile of the Company
and corresponding percentage of the target number of performance-based RSUs vesting are shown in the table
below.
Vesting Dates
May 2012 May 2013 May 2014 May 2015
Fiscal 2012
Performance-
Based RSU
Award
Measurement Period Fiscal 2012 Fiscal 2012 – 2013 Fiscal 2012 –2014
TSR Percentile 42nd 31st
To Be Determined
Percent of Target
Shares Vesting 64% 42%
Fiscal 2013
Performance-
Based RSU
Award
Measurement Period Fiscal 2013 Fiscal 2013 –2014 Fiscal 2013 –2015
TSR Percentile 64th
To Be Determined To Be Determined
Percent of Target
Shares Vesting 112%
Retention Equity Awards
In fiscal 2013, the Company continued to experience significant recruiting pressure from our peer companies,
start-up companies and large diversified technology and entertainment companies. The Committee looked at a
number of alternatives to help promote long-term retention and decided to grant additional time-based RSUs to
eight members of our Company-wide executive team during fiscal 2013, including three NEOs (Mr. Gibeau,
Mr. Wilson and Mr. Söderlund). One hundred-percent of these RSUs will vest on May 18, 2015. The Committee
elected to use a longer-term vesting schedule to promote retention of these executives during the execution of
31