Electronic Arts 2013 Annual Report Download - page 38
Download and view the complete annual report
Please find page 38 of the 2013 Electronic Arts annual report below. You can navigate through the pages in the report by either clicking on the pages listed below, or by using the keyword search tool below to find specific information within the annual report.-
 1
1 -
2
-
3
-
4
-
5
-
6
-
7
-
8
-
9
-
10
-
11
-
12
-
13
-
14
-
15
-
16
-
17
-
18
-
19
-
20
-
21
-
22
-
23
-
24
-
25
-
26
-
27
-
 28
28 -
 29
29 -
 30
30 -
 31
31 -
 32
32 -
 33
33 -
 34
34 -
 35
35 -
 36
36 -
 37
37 -
 38
38 -
 39
39 -
 40
40 -
 41
41 -
 42
42 -
 43
43 -
 44
44 -
 45
45 -
 46
46 -
 47
47 -
 48
48 -
49
-
50
-
51
-
52
-
53
-
54
-
55
-
56
-
57
-
58
-
59
-
60
-
61
-
62
-
63
-
64
-
65
-
66
-
67
-
68
-
69
-
70
-
71
-
72
-
73
-
74
-
75
-
76
-
77
-
78
-
79
-
80
-
81
-
82
-
83
-
84
-
85
-
86
-
87
-
88
-
89
-
90
-
91
-
92
-
93
-
94
-
95
-
96
-
97
-
98
-
99
-
100
-
101
-
102
-
103
-
104
-
105
-
106
-
107
-
108
-
109
-
110
-
111
-
112
-
113
-
114
-
115
-
116
-
117
-
118
-
119
-
120
-
121
-
122
-
123
-
124
-
125
-
126
-
127
-
128
-
129
-
130
-
131
-
132
-
133
-
134
-
135
-
136
-
137
-
138
-
139
-
140
-
141
-
142
-
143
-
144
-
145
-
146
-
147
-
148
-
149
-
150
-
151
-
152
-
153
-
154
-
155
-
156
-
157
-
158
-
159
-
160
-
161
-
162
-
163
-
164
-
165
-
166
-
167
-
168
-
169
-
170
-
171
-
172
-
173
-
174
-
175
-
176
-
177
-
178
-
179
-
180
-
181
-
182
-
183
-
184
-
185
-
186
-
187
-
188
-
189
-
190
-
191
-
192
-
193
-
194
-
195
-
196
-
197
-
198
-
199
-
200
-
201
-
202
-
203
-
204
 |
 |
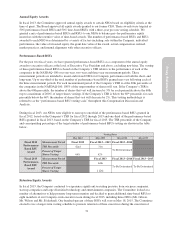
Fiscal 2013 Financial and Operational Highlights
The Company continued to make progress on a number of key operational and strategic goals for 2013 including:
• Continuing our Digital Transformation — Our non-GAAP digital revenues increased by 36% over the
prior year driven by (1) online-delivered content and services such as FIFA and Madden Ultimate Team
and the Battlefield 3 Premium subscription service and (2) strength in mobile with hits such as The
Simpsons Tapped Out and Real Racing 3.
• Continuing to Deliver Blockbuster Titles such as FIFA 13,Madden NFL 13, and Need for Speed: Most
Wanted. For fiscal 2013, EA had two of the top five and five of the top 20 games in North America and
Europe (combined) on high-definition platforms (PC, Xbox 360 and PlayStation 3).
• Preparing for Next-generation Console Platforms – We continued to invest in next-generation console
technologies and content, including next-generation editions of our two biggest franchises, FIFA and
Battlefield, which will position the Company well in the transition to new console platforms.
In January 2013, we revised down the fiscal year non-GAAP earnings per share guidance and our fiscal year
financial results came in at the low end of our revenue guidance and slightly below our revised earnings per share
guidance.
COMPENSATION PRINCIPLES AND STRUCTURE
Our compensation programs are designed to motivate our NEOs to achieve financial, strategic, and operational
objectives and to create long-term stockholder value. The programs are guided by a compensation philosophy
based on three core principles, with each of these principles intended to promote a pay-for-performance approach
to executive compensation:
• Principle 1 — Cash Compensation: A significant portion of each NEO’s cash compensation should be at
risk based on the annual financial and operational performance of the Company and, where applicable,
the NEO’s business unit;
• Principle 2 — Equity Compensation: A significant portion of each NEO’s total compensation should be
provided in the form of long-term equity to enhance alignment between the interests of our NEOs and our
stockholders and to promote long-term retention of a strong leadership team in an industry that is highly
competitive for executive talent; and
• Principle 3 —Target Total Direct Compensation: The target total direct compensation package for each
NEO should be consistent with market practices for executive talent, as well as each NEO’s individual
experience, responsibilities and performance.
We believe these principles promote the long-term profitability and growth of the Company and help align
compensation with the long-term interests of the Company’s stockholders. These principles guide the Committee
and the design of the Company’s executive compensation programs and are reflected in the Company’s
compensation programs for fiscal 2013 as follows:
Principle 1 — Cash Compensation: The cash compensation of each NEO consists of a market competitive base
salary and the opportunity to earn an annual cash bonus. Each NEO is assigned a target bonus opportunity
(expressed as a percentage of base salary). In aggregate, cash bonuses represent approximately half of our NEOs’
targeted cash compensation, and serve to put a significant portion of their cash compensation at risk.
In fiscal 2013, our performance was mixed. We achieved a number of key objectives, but missed important
financial goals, as discussed above in “Fiscal 2013 Financial and Operational Highlights”. This performance led
to the funding of an overall Company bonus pool at 71% and aggregate annual bonus award payouts to our
eligible NEOs of 36% of their target bonus opportunity. Individual award details are described in the “Individual
NEO Compensation” sections below.
Principle 2 — Equity Compensation: Approximately three quarters of the aggregate target compensation of our
NEOs for fiscal 2013 was provided in the form of equity.
30