Electronic Arts 2013 Annual Report Download - page 133
Download and view the complete annual report
Please find page 133 of the 2013 Electronic Arts annual report below. You can navigate through the pages in the report by either clicking on the pages listed below, or by using the keyword search tool below to find specific information within the annual report.-
 1
1 -
2
-
3
-
4
-
5
-
6
-
7
-
8
-
9
-
10
-
11
-
12
-
13
-
14
-
15
-
16
-
17
-
18
-
19
-
20
-
21
-
22
-
23
-
24
-
25
-
26
-
27
-
28
-
29
-
30
-
31
-
32
-
33
-
34
-
35
-
36
-
37
-
38
-
39
-
40
-
41
-
42
-
43
-
44
-
45
-
46
-
47
-
48
-
49
-
50
-
51
-
52
-
53
-
54
-
55
-
56
-
57
-
58
-
59
-
60
-
61
-
62
-
63
-
64
-
65
-
66
-
67
-
68
-
69
-
70
-
71
-
72
-
73
-
74
-
75
-
76
-
77
-
78
-
79
-
80
-
81
-
82
-
83
-
84
-
85
-
86
-
87
-
88
-
89
-
90
-
91
-
92
-
93
-
94
-
95
-
96
-
97
-
98
-
99
-
100
-
101
-
102
-
103
-
104
-
105
-
106
-
107
-
108
-
109
-
110
-
111
-
112
-
113
-
114
-
115
-
116
-
117
-
118
-
119
-
120
-
121
-
122
-
 123
123 -
 124
124 -
 125
125 -
 126
126 -
 127
127 -
 128
128 -
 129
129 -
 130
130 -
 131
131 -
 132
132 -
 133
133 -
 134
134 -
 135
135 -
 136
136 -
 137
137 -
 138
138 -
 139
139 -
 140
140 -
 141
141 -
 142
142 -
 143
143 -
144
-
145
-
146
-
147
-
148
-
149
-
150
-
151
-
152
-
153
-
154
-
155
-
156
-
157
-
158
-
159
-
160
-
161
-
162
-
163
-
164
-
165
-
166
-
167
-
168
-
169
-
170
-
171
-
172
-
173
-
174
-
175
-
176
-
177
-
178
-
179
-
180
-
181
-
182
-
183
-
184
-
185
-
186
-
187
-
188
-
189
-
190
-
191
-
192
-
193
-
194
-
195
-
196
-
197
-
198
-
199
-
200
-
201
-
202
-
203
-
204
 |
 |

Annual Report
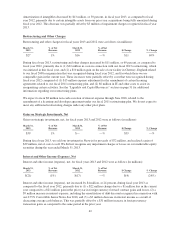
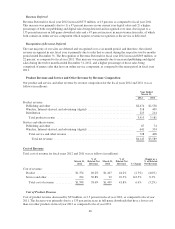
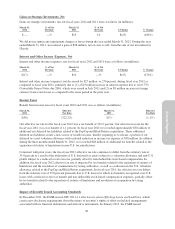
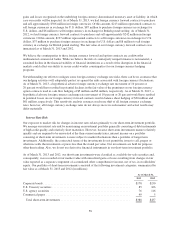
Gains on Strategic Investments, Net
Gains on strategic investments, net, for fiscal years 2012 and 2011 were as follows (in millions):
March 31,
2012
% of Net
Revenue
March 31,
2011
% of Net
Revenue $ Change % Change
$ — —% $23 1% $(23) (100%)
We did not recognize any impairment charges or losses during the year ended March 31, 2012. During the year
ended March 31, 2011, we realized a gain of $28 million, net of costs to sell, from the sale of our investment in
Ubisoft.
Interest and Other Income (Expense), Net
Interest and other income (expense), net, for fiscal years 2012 and 2011 were as follows (in millions):
March 31,
2012
% of Net
Revenue
March 31,
2011
% of Net
Revenue $ Change % Change
$(17) —% $10 —% $(27) (270%)
Interest and other income (expense), net decreased by $27 million, or 270 percent, during fiscal year 2012 as
compared to fiscal year 2011, primarily due to (1) a $19 million increase in interest expense due to our 0.75%
Convertible Senior Notes due 2016, which were issued in July 2011 and (2) an $8 million increase in foreign
currency transaction losses as compared to the same period in the prior year.
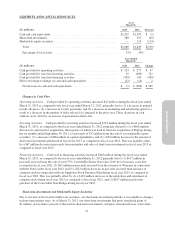
Income Taxes
Benefit from income taxes for fiscal years 2012 and 2011 was as follows (in millions):
March 31,
2012
Effective
Tax Rate
March 31,
2011
Effective
Tax Rate
$(58) (322.2%) $(3) (1.1%)
Our effective tax rate for the fiscal year 2012 was a tax benefit of 322.2 percent. Our effective tax rate for the
fiscal year 2011 was a tax benefit of 1.1 percent. In fiscal year 2012 we recorded approximately $58 million of
additional net deferred tax liabilities related to the PopCap and KlickNation acquisitions. These additional
deferred tax liabilities create a new source of taxable income, thereby requiring us to release a portion of our
deferred tax asset valuation allowance with a related reduction in income tax expense of $58 million. In addition,
during the three months ended March 31, 2012, we recorded $48 million of additional tax benefits related to the
expiration of statutes of limitations in non-U.S. tax jurisdictions.
Consistent with prior years, the fiscal year 2012 effective tax rate continues to differ from the statutory rate of
35.0 percent as a result of the utilization of U.S. deferred tax assets subject to a valuation allowance and non-U.S.
profits subject to a reduced or zero tax rate, partially offset by non-deductible stock-based compensation. In
addition, the fiscal year 2012 effective tax rate is impacted by tax benefits related to the expiration of statutes of
limitations and the resolution of examinations by taxing authorities, as well as a reduction in the U.S. valuation
allowance related to the PopCap and KlickNation acquisitions. In fiscal year 2011, the effective tax rate differs
from the statutory rate of 35.0 percent primarily due to U.S. losses for which no benefit is recognized, non-U.S.
losses with a reduced or zero tax benefit and non-deductible stock-based compensation expenses, partially offset
by tax benefits related to the expiration of statutes of limitations and resolution of examination by taxing
authorities.
Impact of Recently Issued Accounting Standards
In December 2011, the FASB issued ASU 2011-11, Disclosures about Offsetting Assets and Liabilities, which
creates new disclosure requirements about the nature of an entity’s rights of offset and related arrangements
associated with its financial instruments and derivative instruments. In January 2013, the FASB issued
49