Electronic Arts 2013 Annual Report Download - page 149
Download and view the complete annual report
Please find page 149 of the 2013 Electronic Arts annual report below. You can navigate through the pages in the report by either clicking on the pages listed below, or by using the keyword search tool below to find specific information within the annual report.-
 1
1 -
2
-
3
-
4
-
5
-
6
-
7
-
8
-
9
-
10
-
11
-
12
-
13
-
14
-
15
-
16
-
17
-
18
-
19
-
20
-
21
-
22
-
23
-
24
-
25
-
26
-
27
-
28
-
29
-
30
-
31
-
32
-
33
-
34
-
35
-
36
-
37
-
38
-
39
-
40
-
41
-
42
-
43
-
44
-
45
-
46
-
47
-
48
-
49
-
50
-
51
-
52
-
53
-
54
-
55
-
56
-
57
-
58
-
59
-
60
-
61
-
62
-
63
-
64
-
65
-
66
-
67
-
68
-
69
-
70
-
71
-
72
-
73
-
74
-
75
-
76
-
77
-
78
-
79
-
80
-
81
-
82
-
83
-
84
-
85
-
86
-
87
-
88
-
89
-
90
-
91
-
92
-
93
-
94
-
95
-
96
-
97
-
98
-
99
-
100
-
101
-
102
-
103
-
104
-
105
-
106
-
107
-
108
-
109
-
110
-
111
-
112
-
113
-
114
-
115
-
116
-
117
-
118
-
119
-
120
-
121
-
122
-
123
-
124
-
125
-
126
-
127
-
128
-
129
-
130
-
131
-
132
-
133
-
134
-
135
-
136
-
137
-
138
-
 139
139 -
 140
140 -
 141
141 -
 142
142 -
 143
143 -
 144
144 -
 145
145 -
 146
146 -
 147
147 -
 148
148 -
 149
149 -
 150
150 -
 151
151 -
 152
152 -
 153
153 -
 154
154 -
 155
155 -
 156
156 -
 157
157 -
 158
158 -
 159
159 -
160
-
161
-
162
-
163
-
164
-
165
-
166
-
167
-
168
-
169
-
170
-
171
-
172
-
173
-
174
-
175
-
176
-
177
-
178
-
179
-
180
-
181
-
182
-
183
-
184
-
185
-
186
-
187
-
188
-
189
-
190
-
191
-
192
-
193
-
194
-
195
-
196
-
197
-
198
-
199
-
200
-
201
-
202
-
203
-
204
 |
 |

Annual Report
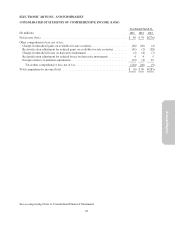
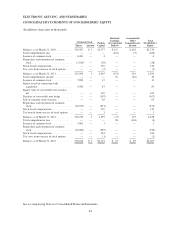
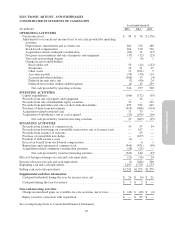
ELECTRONIC ARTS INC. AND SUBSIDIARIES
CONSOLIDATED STATEMENTS OF CASH FLOWS
Year Ended March 31,
(In millions) 2013 2012 2011
OPERATING ACTIVITIES
Net income (loss) .................................................. $ 98 $ 76 $ (276)
Adjustments to reconcile net income (loss) to net cash provided by operating
activities:
Depreciation, amortization and accretion, net .......................... 264 216 180
Stock-based compensation ......................................... 164 170 176
Acquisition-related contingent consideration .......................... (64) 11 (17)
Net gains on investments and sale of property and equipment ............. (37) (12) (25)
Non-cash restructuring charges ..................................... 7 (6) 1
Change in assets and liabilities:
Receivables, net ............................................... 56 (14) (122)
Inventories ................................................... 16 21 25
Other assets ................................................... 15 (101) 5
Accounts payable .............................................. (78) (50) 114
Accrued and other liabilities ...................................... (106) 13 (4)
Deferred income taxes, net ....................................... (7) (90) 24
Deferred net revenue (online-enabled games) ........................ (4) 43 239
Net cash provided by operating activities ......................... 324 277 320
INVESTING ACTIVITIES
Capital expenditures ................................................ (106) (172) (59)
Proceeds from sale of property and equipment ........................... — 26 —
Proceeds from sale of marketable equity securities ........................ 72 — 132
Proceeds from maturities and sales of short-term investments ............... 459 526 442
Purchase of short-term investments .................................... (414) (468) (514)
Acquisition-related restricted cash ..................................... 31 75 —
Acquisition of subsidiaries, net of cash acquired .......................... (10) (676) (16)
Net cash provided by (used in) investing activities .................. 32 (689) (15)
FINANCING ACTIVITIES
Proceeds from issuance of common stock ............................... 34 57 34
Proceeds from borrowings on convertible senior notes, net of issuance costs . . . — 617 —
Proceeds from issuance of warrants .................................... — 65 —
Purchase of convertible note hedge .................................... — (107) —
Payment of debt issuance costs ....................................... (2) — —
Excess tax benefit from stock-based compensation ........................ — 4 1
Repurchase and retirement of common stock ............................ (349) (471) (58)
Acquisition-related contingent consideration payment ..................... (28) (25) —
Net cash provided by (used in) financing activities .................. (345) 140 (23)
Effect of foreign exchange on cash and cash equivalents ..................... (12) (14) 24
Increase (decrease) in cash and cash equivalents ............................ (1) (286) 306
Beginning cash and cash equivalents ..................................... 1,293 1,579 1,273
Ending cash and cash equivalents ....................................... $1,292 $1,293 $1,579
Supplemental cash flow information:
Cash paid (refunded) during the year for income taxes, net ................. $ 26 $ (4) $ 21
Cash paid during the year for interest .................................. $ 5 $ 2 $ —
Non-cash investing activities:
Change in unrealized gains on available-for-sale securities, net of taxes ....... $ (46) $ (40) $ (4)
Equity issued in connection with acquisition ............................. $ — $ 87 $ —
See accompanying Notes to Consolidated Financial Statements.
65