Electronic Arts 2013 Annual Report Download - page 163
Download and view the complete annual report
Please find page 163 of the 2013 Electronic Arts annual report below. You can navigate through the pages in the report by either clicking on the pages listed below, or by using the keyword search tool below to find specific information within the annual report.-
 1
1 -
2
-
3
-
4
-
5
-
6
-
7
-
8
-
9
-
10
-
11
-
12
-
13
-
14
-
15
-
16
-
17
-
18
-
19
-
20
-
21
-
22
-
23
-
24
-
25
-
26
-
27
-
28
-
29
-
30
-
31
-
32
-
33
-
34
-
35
-
36
-
37
-
38
-
39
-
40
-
41
-
42
-
43
-
44
-
45
-
46
-
47
-
48
-
49
-
50
-
51
-
52
-
53
-
54
-
55
-
56
-
57
-
58
-
59
-
60
-
61
-
62
-
63
-
64
-
65
-
66
-
67
-
68
-
69
-
70
-
71
-
72
-
73
-
74
-
75
-
76
-
77
-
78
-
79
-
80
-
81
-
82
-
83
-
84
-
85
-
86
-
87
-
88
-
89
-
90
-
91
-
92
-
93
-
94
-
95
-
96
-
97
-
98
-
99
-
100
-
101
-
102
-
103
-
104
-
105
-
106
-
107
-
108
-
109
-
110
-
111
-
112
-
113
-
114
-
115
-
116
-
117
-
118
-
119
-
120
-
121
-
122
-
123
-
124
-
125
-
126
-
127
-
128
-
129
-
130
-
131
-
132
-
133
-
134
-
135
-
136
-
137
-
138
-
139
-
140
-
141
-
142
-
143
-
144
-
145
-
146
-
147
-
148
-
149
-
150
-
151
-
152
-
 153
153 -
 154
154 -
 155
155 -
 156
156 -
 157
157 -
 158
158 -
 159
159 -
 160
160 -
 161
161 -
 162
162 -
 163
163 -
 164
164 -
 165
165 -
 166
166 -
 167
167 -
 168
168 -
 169
169 -
 170
170 -
 171
171 -
 172
172 -
 173
173 -
174
-
175
-
176
-
177
-
178
-
179
-
180
-
181
-
182
-
183
-
184
-
185
-
186
-
187
-
188
-
189
-
190
-
191
-
192
-
193
-
194
-
195
-
196
-
197
-
198
-
199
-
200
-
201
-
202
-
203
-
204
 |
 |

Annual Report
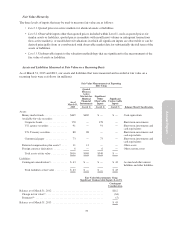
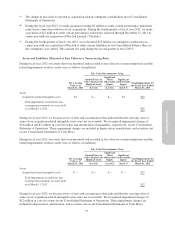
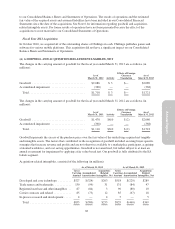
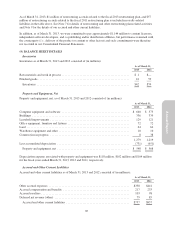
We had no marketable equity securities as of March 31, 2013. Marketable equity securities consisted of the
following as of March 31, 2012 (in millions):
Adjusted
Cost
Gross
Unrealized
Gains
Gross
Unrealized
Losses
Fair
Value
As of March 31, 2012 .................................... $32 $87 $— $119
Our marketable equity securities as of March 31, 2012 consisted of common shares of Neowiz Corporation and
Neowiz Games, collectively referred to as “Neowiz.” During the fiscal year ended March 31, 2013, we sold our
investment in Neowiz and received proceeds of $72 million and realized a gain of $39 million, net of costs to
sell. The realized gain is included in gains on strategic investments, net, in our Consolidated Statements of
Operations. We did not recognize any impairment charges on our marketable equity securities during the fiscal
years 2013 and 2012.
During the fiscal year ended March 31, 2011, we sold our investments in Ubisoft Entertainment (“Ubisoft”) and
The9 Limited (“The9”) and received proceeds of $121 million and $11 million, respectively, and realized a gain
of $28 million and a loss of $3 million, respectively, net of costs to sell. The realized gain and loss are included
in gains on strategic investments, net, in our Consolidated Statements of Operations.
Due to various factors, including but not limited to, the extent and duration during which the market prices of
these securities had been below adjusted cost and our intent to hold certain securities, we recognized impairment
charges attributed to unrealized losses on our investment in The9 that we concluded were other-than-temporary
in the amount of $2 million during the fiscal year ended March 31, 2011. The impairment charges for the fiscal
year ended March 31, 2011 are included in gains on strategic investments, net, in our Consolidated Statements of
Operations.
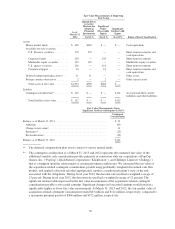
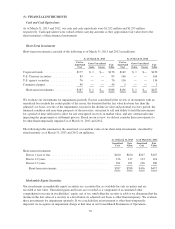
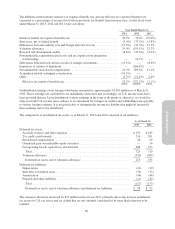
0.75% Convertible Senior Notes Due 2016
The following table summarizes the carrying value and fair value of our 0.75% Convertible Senior Notes due
2016 as of March 31, 2013 and 2012 (in millions):
As of March 31, 2013 As of March 31, 2012
Carrying
Value
Fair
Value
Carrying
Value
Fair
Value
0.75% Convertible Senior Notes due 2016 ........................ $559 $614 $539 $584
The carrying value of the 0.75% Convertible Senior Notes due 2016 excludes the fair value of the equity
conversion feature, which was classified as equity upon issuance, while the fair value is based on quoted market
prices for the 0.75% Convertible Senior Notes due 2016, which includes the equity conversion feature. The fair
value of the 0.75% Convertible Senior Notes due 2016 is classified as Level 2 within the fair value hierarchy. See
Note 11 for additional information related to our 0.75% Convertible Senior Notes due 2016.
(4) DERIVATIVE FINANCIAL INSTRUMENTS
The assets or liabilities associated with our derivative instruments and hedging activities are recorded at fair
value in other current assets or accrued and other current liabilities, respectively, on our Consolidated Balance
Sheets. As discussed below, the accounting for gains and losses resulting from changes in fair value depends on
the use of the derivative instrument and whether it is designated and qualifies for hedge accounting.
We transact business in various foreign currencies and have significant international sales and expenses
denominated in foreign currencies, subjecting us to foreign currency risk. We purchase foreign currency option
contracts, generally with maturities of 12 months or less, to reduce the volatility of cash flows primarily related
to forecasted revenue and expenses denominated in certain foreign currencies. Our cash flow risks are primarily
related to fluctuations in the Euro, British pound sterling and Canadian dollar. In addition, we utilize foreign
currency forward contracts to mitigate foreign exchange rate risk associated with foreign-currency-denominated
79