Electronic Arts 2013 Annual Report Download - page 121
Download and view the complete annual report
Please find page 121 of the 2013 Electronic Arts annual report below. You can navigate through the pages in the report by either clicking on the pages listed below, or by using the keyword search tool below to find specific information within the annual report.-
 1
1 -
2
-
3
-
4
-
5
-
6
-
7
-
8
-
9
-
10
-
11
-
12
-
13
-
14
-
15
-
16
-
17
-
18
-
19
-
20
-
21
-
22
-
23
-
24
-
25
-
26
-
27
-
28
-
29
-
30
-
31
-
32
-
33
-
34
-
35
-
36
-
37
-
38
-
39
-
40
-
41
-
42
-
43
-
44
-
45
-
46
-
47
-
48
-
49
-
50
-
51
-
52
-
53
-
54
-
55
-
56
-
57
-
58
-
59
-
60
-
61
-
62
-
63
-
64
-
65
-
66
-
67
-
68
-
69
-
70
-
71
-
72
-
73
-
74
-
75
-
76
-
77
-
78
-
79
-
80
-
81
-
82
-
83
-
84
-
85
-
86
-
87
-
88
-
89
-
90
-
91
-
92
-
93
-
94
-
95
-
96
-
97
-
98
-
99
-
100
-
101
-
102
-
103
-
104
-
105
-
106
-
107
-
108
-
109
-
110
-
 111
111 -
 112
112 -
 113
113 -
 114
114 -
 115
115 -
 116
116 -
 117
117 -
 118
118 -
 119
119 -
 120
120 -
 121
121 -
 122
122 -
 123
123 -
 124
124 -
 125
125 -
 126
126 -
 127
127 -
 128
128 -
 129
129 -
 130
130 -
 131
131 -
132
-
133
-
134
-
135
-
136
-
137
-
138
-
139
-
140
-
141
-
142
-
143
-
144
-
145
-
146
-
147
-
148
-
149
-
150
-
151
-
152
-
153
-
154
-
155
-
156
-
157
-
158
-
159
-
160
-
161
-
162
-
163
-
164
-
165
-
166
-
167
-
168
-
169
-
170
-
171
-
172
-
173
-
174
-
175
-
176
-
177
-
178
-
179
-
180
-
181
-
182
-
183
-
184
-
185
-
186
-
187
-
188
-
189
-
190
-
191
-
192
-
193
-
194
-
195
-
196
-
197
-
198
-
199
-
200
-
201
-
202
-
203
-
204
 |
 |

Annual Report
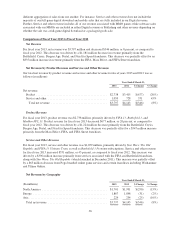
Net revenue in North America was $1,701 million, or 45 percent of total net revenue for fiscal year 2013,
compared to $1,991 million, or 48 percent of total net revenue for fiscal year 2012, a decrease of $290 million, or
15 percent. This decrease was driven by a $657 million decrease from certain franchises including Battlefield,
Dragon Age, Portal, Crysis, and Need for Speed franchises. This decrease was offset by a $367 million increase
primarily from the Mass Effect franchise, as well as Star Wars: The Old Republic and Kingdoms of Amalur:
Reckoning. Net revenue in Europe was $1,867 million, or 49 percent of total net revenue during fiscal year 2013,
compared to $1,898 million, or 46 percent of total net revenue during fiscal year 2012, a decrease of $31 million,
or 2 percent. We estimate that foreign exchange rates (primarily due to the Euro and Swiss Franc) decreased
reported net revenue in Europe by approximately $119 million, or 6 percent, for fiscal year 2013. Excluding the
effect of foreign exchange rates from Net revenue in Europe, we estimate that Net revenue in Europe increased
by approximately $88 million, or 4 percent, for fiscal year 2013 as compared to fiscal year 2012. Net revenue in
Europe increased primarily due to our Battlefield, Crysis, Need for Speed, Dragon Age, and The Sims franchises,
partially offset by decreased revenue in our FIFA, Mass Effect, and FIFA Street franchises during fiscal year
2013. Net revenue in Asia was $229 million, or 6 percent of total net revenue for fiscal year 2013, compared to
$254 million, or 6 percent of total net revenue for fiscal year 2012, a decrease of $25 million, or 10 percent. We
estimate that foreign exchange rates decreased reported net revenue in Asia by approximately $8 million, or
3 percent, for fiscal year 2013. Excluding the effect of foreign exchange rates from Net revenue in Asia, we
estimate that Net revenue in Asia decreased by approximately $17 million, or 7 percent, for fiscal year 2013 as
compared to fiscal year 2012. Net revenue in Asia decreased primarily due to decreased sales in our Crysis,
Battlefield, Portal, Dragon Age, and Alice franchises partially offset by increased revenue in our FIFA, Mass
Effect, and Medal of Honor franchises during fiscal year 2013.
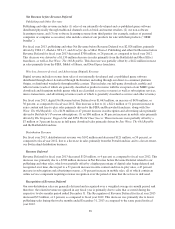
Supplemental Net Revenue by Revenue Composition
As we continue to evolve our business and more of our products are delivered to consumers digitally, we place a
greater emphasis and focus on assessing our business through a review of net revenue by revenue composition.
Net Revenue before Revenue Deferral, a non-GAAP financial measure, is provided in this section of MD&A,
including a discussion of the components of this measure: (1) publishing and other, (2) wireless, Internet-derived,
and advertising (digital), and (3) distribution. See “Non-GAAP Financial Measures” below for an explanation of
our use of this non-GAAP financial measure. A reconciliation to the corresponding measure calculated in
accordance with U.S. GAAP is provided in the discussion below.
“Revenue Deferral” in this “Net Revenue” section generally includes the unrecognized revenue from bundled
sales of certain online-enabled games for which we do not have VSOE for the unspecified updates. Fluctuations
in the Revenue Deferral are largely dependent upon the amounts of products that we sell with the online features
and services previously discussed, while the Recognition of Revenue Deferral for a period is also dependent upon
(1) the amount deferred, (2) the period of time the software-related offerings are to be provided, and (3) the
timing of the sale. For example, most Revenue Deferrals incurred in the first half of a fiscal year are recognized
within the same fiscal year; however, substantially all of the Revenue Deferrals incurred in the last month of a
fiscal year will be recognized in the subsequent fiscal year.
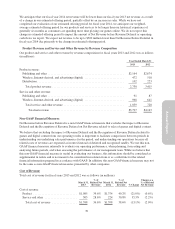
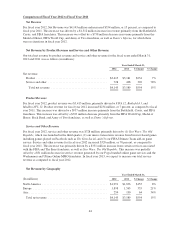
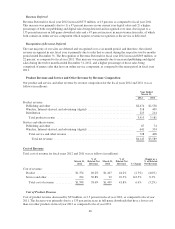
Our total net revenue by revenue composition for fiscal years 2013 and 2012 was as follows (in millions):
Year Ended March 31,
2013 2012 $ Change % Change
Publishing and other ........................................ $2,028 $ 2,736 $(708) (26%)
Wireless, Internet-derived, and advertising (digital) ............... 1,663 1,227 436 36%
Distribution ............................................... 102 223 (121) (54%)
Net Revenue before Revenue Deferral ........................ 3,793 4,186 (393) (9%)
Revenue Deferral .......................................... (3,022) (3,142) 120 4%
Recognition of Revenue Deferral .............................. 3,026 3,099 (73) (2%)
Total net revenue ........................................ $3,797 $ 4,143 $(346) (8%)
37