Electronic Arts 2013 Annual Report Download - page 162
Download and view the complete annual report
Please find page 162 of the 2013 Electronic Arts annual report below. You can navigate through the pages in the report by either clicking on the pages listed below, or by using the keyword search tool below to find specific information within the annual report.-
 1
1 -
2
-
3
-
4
-
5
-
6
-
7
-
8
-
9
-
10
-
11
-
12
-
13
-
14
-
15
-
16
-
17
-
18
-
19
-
20
-
21
-
22
-
23
-
24
-
25
-
26
-
27
-
28
-
29
-
30
-
31
-
32
-
33
-
34
-
35
-
36
-
37
-
38
-
39
-
40
-
41
-
42
-
43
-
44
-
45
-
46
-
47
-
48
-
49
-
50
-
51
-
52
-
53
-
54
-
55
-
56
-
57
-
58
-
59
-
60
-
61
-
62
-
63
-
64
-
65
-
66
-
67
-
68
-
69
-
70
-
71
-
72
-
73
-
74
-
75
-
76
-
77
-
78
-
79
-
80
-
81
-
82
-
83
-
84
-
85
-
86
-
87
-
88
-
89
-
90
-
91
-
92
-
93
-
94
-
95
-
96
-
97
-
98
-
99
-
100
-
101
-
102
-
103
-
104
-
105
-
106
-
107
-
108
-
109
-
110
-
111
-
112
-
113
-
114
-
115
-
116
-
117
-
118
-
119
-
120
-
121
-
122
-
123
-
124
-
125
-
126
-
127
-
128
-
129
-
130
-
131
-
132
-
133
-
134
-
135
-
136
-
137
-
138
-
139
-
140
-
141
-
142
-
143
-
144
-
145
-
146
-
147
-
148
-
149
-
150
-
151
-
 152
152 -
 153
153 -
 154
154 -
 155
155 -
 156
156 -
 157
157 -
 158
158 -
 159
159 -
 160
160 -
 161
161 -
 162
162 -
 163
163 -
 164
164 -
 165
165 -
 166
166 -
 167
167 -
 168
168 -
 169
169 -
 170
170 -
 171
171 -
 172
172 -
173
-
174
-
175
-
176
-
177
-
178
-
179
-
180
-
181
-
182
-
183
-
184
-
185
-
186
-
187
-
188
-
189
-
190
-
191
-
192
-
193
-
194
-
195
-
196
-
197
-
198
-
199
-
200
-
201
-
202
-
203
-
204
 |
 |

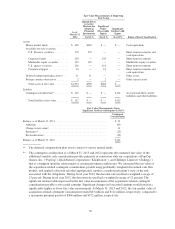
(3) FINANCIAL INSTRUMENTS
Cash and Cash Equivalents
As of March 31, 2013 and 2012, our cash and cash equivalents were $1,292 million and $1,293 million,
respectively. Cash equivalents were valued at their carrying amounts as they approximate fair value due to the
short maturities of these financial instruments.
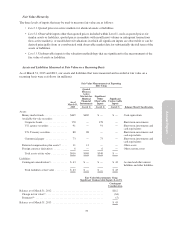
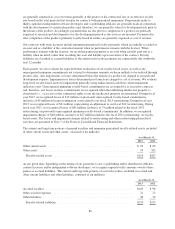
Short-Term Investments
Short-term investments consisted of the following as of March 31, 2013 and 2012 (in millions):
As of March 31, 2013 As of March 31, 2012
Cost or
Amortized
Cost
Gross Unrealized Fair
Value
Cost or
Amortized
Cost
Gross Unrealized Fair
ValueGains Losses Gains Losses
Corporate bonds ................... $177 $ 1 $— $178 $149 $ 1 $— $150
U.S. Treasury securities ............. 85 — — 85 166 — — 166
U.S. agency securities ............... 76 — — 76 116 — — 116
Commercial paper .................. 49 — — 49 5 — — 5
Short-term investments ............ $387 $ 1 $— $388 $436 $ 1 $— $437
We evaluate our investments for impairment quarterly. Factors considered in the review of investments with an
unrealized loss include the credit quality of the issuer, the duration that the fair value has been less than the
adjusted cost basis, severity of the impairment, reason for the decline in value and potential recovery period, the
financial condition and near-term prospects of the investees, our intent to sell and ability to hold the investment
for a period of time sufficient to allow for any anticipated recovery in market value, and any contractual terms
impacting the prepayment or settlement process. Based on our review, we did not consider these investments to
be other-than-temporarily impaired as of March 31, 2013 and 2012.
The following table summarizes the amortized cost and fair value of our short-term investments, classified by
stated maturity as of March 31, 2013 and 2012 (in millions):
As of March 31, 2013 As of March 31, 2012
Amortized
Cost
Fair
Value
Amortized
Cost
Fair
Value
Short-term investments
Due in 1 year or less ....................................... $160 $160 $207 $207
Due in 1-2 years .......................................... 126 127 123 124
Due in 2-3 years .......................................... 101 101 106 106
Short-term investments ................................... $387 $388 $436 $437
Marketable Equity Securities
Our investments in marketable equity securities are accounted for as available-for-sale securities and are
recorded at fair value. Unrealized gains and losses are recorded as a component of accumulated other
comprehensive income in stockholders’ equity, net of tax, until either the security is sold or we determine that the
decline in the fair value of a security to a level below its adjusted cost basis is other-than-temporary. We evaluate
these investments for impairment quarterly. If we conclude that an investment is other-than-temporarily
impaired, we recognize an impairment charge at that time in our Consolidated Statements of Operations.
78