Dish Network 2001 Annual Report Download - page 76
Download and view the complete annual report
Please find page 76 of the 2001 Dish Network annual report below. You can navigate through the pages in the report by either clicking on the pages listed below, or by using the keyword search tool below to find specific information within the annual report.-
 1
1 -
2
-
3
-
4
-
5
-
6
-
7
-
8
-
9
-
10
-
11
-
12
-
13
-
14
-
15
-
16
-
17
-
18
-
19
-
20
-
21
-
22
-
23
-
24
-
25
-
26
-
27
-
28
-
29
-
30
-
31
-
32
-
33
-
34
-
35
-
36
-
37
-
38
-
39
-
40
-
41
-
42
-
43
-
44
-
45
-
46
-
47
-
48
-
49
-
50
-
51
-
52
-
53
-
54
-
55
-
56
-
57
-
58
-
59
-
60
-
61
-
62
-
63
-
64
-
65
-
 66
66 -
 67
67 -
 68
68 -
 69
69 -
 70
70 -
 71
71 -
 72
72 -
 73
73 -
 74
74 -
 75
75 -
 76
76 -
 77
77 -
 78
78 -
 79
79 -
 80
80 -
 81
81 -
 82
82 -
 83
83 -
 84
84 -
 85
85 -
 86
86 -
87
-
88
-
89
-
90
-
91
-
92
-
93
-
94
-
95
-
96
-
97
-
98
-
99
-
100
-
101
-
102
-
103
-
104
-
105
-
106
-
107
-
108
 |
 |

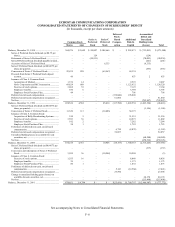
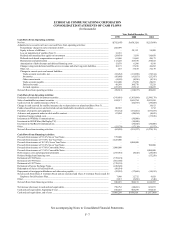
ECHOSTAR COMMUNICATIONS CORPORATION
NOTES TO CONSOLIDATED FINANCIAL STATEMENTS – Continued
F–11
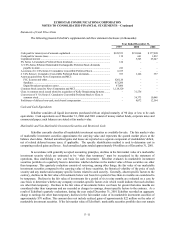
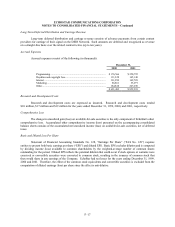
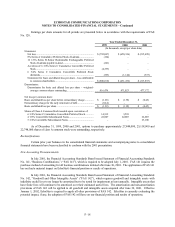
Statements of Cash Flows Data
The following presents EchoStar’s supplemental cash flow statement disclosure (in thousands):
Year Ended December 31,
1999 2000 2001
.
Cash paid for interest, net of amounts capitalized .......................................................... $128,553 $211,064 $ 377,038
Cash paid for income taxes.......................................................................................... 119 641 1,832
Capitalized interest ..................................................................................................... –5,343 25,647
8% Series A Cumulative Preferred Stock dividends ...................................................... 124 – –
12 1/8% Series B Senior Redeemable Exchangeable Preferred Stock dividends
payable in-kind....................................................................................................... 241 – –
Accretion of 6 3/4% Series C Cumulative Convertible Preferred Stock .......................... 6,335 – –
6 3/4% Series C Cumulative Convertible Preferred Stock dividends............................... 553 1,146 337
Assets acquired from News Corporation and MCI:
FCC licenses and other............................................................................................ 626,120 – –
Satellites ................................................................................................................ 451,200 – –
Digital broadcast operations center........................................................................... 47,000 – –
Common Stock issued to News Corporation and MCI ................................................... 1,124,320 – –
Class A common stock issued related to acquisition of Kelly Broadcasting Systems ........ –31,556 –
Conversion of 6 ¾% Series C Cumulative Convertible Preferred Stock to Class A
common stock ........................................................................................................ –34,373 10,948
Forfeitures of deferred non-cash, stock-based compensation .......................................... –8,072 12,564
Cash and Cash Equivalents
EchoStar considers all liquid investments purchased with an original maturity of 90 days or less to be cash
equivalents. Cash equivalents as of December 31, 2000 and 2001 consist of money market funds, corporate notes and
commercial paper; such balances are stated at fair market value.
Marketable and Non-Marketable Investment Securities and Restricted Cash
EchoStar currently classifies all marketable investment securities as available-for-sale. The fair market value
of marketable investment securities approximates the carrying value and represents the quoted market prices at the
balance sheet dates. Related unrealized gains and losses are reported as a separate component of stockholders’ deficit,
net of related deferred income taxes, if applicable. The specific identification method is used to determine cost in
computing realized gains and losses. Such unrealized gains totaled approximately $4 million as of December 31, 2001.
In accordance with generally accepted accounting principles, declines in the fair market value of a marketable
investment security which are estimated to be “other than temporary” must be recognized in the statement of
operations, thus establishing a new cost basis for such investment. EchoStar evaluates its marketable investment
securities portfolio on a quarterly basis to determine whether declines in the market value of these securities are other
than temporary. This quarterly evaluation consists of reviewing, among other things, the fair value of our marketable
investment securities compared to the carrying value of these securities, the historical volatility of the price of each
security and any market and company specific factors related to each security. Generally, absent specific factors to the
contrary, declines in the fair value of investments below cost basis for a period of less than six months are considered to
be temporary. Declines in the fair value of investments for a period of six to nine months are evaluated on a case by
case basis to determine whether any company or market-specific factors exist which would indicate that such declines
are other than temporary. Declines in the fair value of investments below cost basis for greater than nine months are
considered other than temporary and are recorded as charges to earnings, absent specific factors to the contrary. As a
result of EchoStar’s quarterly evaluations, during the year ended December 31, 2001 EchoStar recorded an aggregate
charge to earnings for other than temporary declines in the fair market value of its marketable investment securities of
approximately $70 million. This amount does not include realized gains of approximately $22 million on the sales of
marketable investment securities. If the fair market value of EchoStar’s marketable securities portfolio does not remain