Dish Network 2001 Annual Report Download - page 38
Download and view the complete annual report
Please find page 38 of the 2001 Dish Network annual report below. You can navigate through the pages in the report by either clicking on the pages listed below, or by using the keyword search tool below to find specific information within the annual report.-
 1
1 -
2
-
3
-
4
-
5
-
6
-
7
-
8
-
9
-
10
-
11
-
12
-
13
-
14
-
15
-
16
-
17
-
18
-
19
-
20
-
21
-
22
-
23
-
24
-
25
-
26
-
27
-
 28
28 -
 29
29 -
 30
30 -
 31
31 -
 32
32 -
 33
33 -
 34
34 -
 35
35 -
 36
36 -
 37
37 -
 38
38 -
 39
39 -
 40
40 -
 41
41 -
 42
42 -
 43
43 -
 44
44 -
 45
45 -
 46
46 -
 47
47 -
 48
48 -
49
-
50
-
51
-
52
-
53
-
54
-
55
-
56
-
57
-
58
-
59
-
60
-
61
-
62
-
63
-
64
-
65
-
66
-
67
-
68
-
69
-
70
-
71
-
72
-
73
-
74
-
75
-
76
-
77
-
78
-
79
-
80
-
81
-
82
-
83
-
84
-
85
-
86
-
87
-
88
-
89
-
90
-
91
-
92
-
93
-
94
-
95
-
96
-
97
-
98
-
99
-
100
-
101
-
102
-
103
-
104
-
105
-
106
-
107
-
108
 |
 |

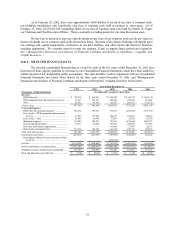
36
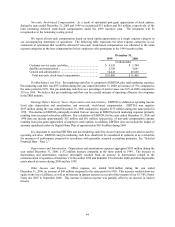
As of December 31,
1997 1998 1999 2000 2001
(In thousands)
Balance Sheets Data
Cash, cash equivalents and marketable investment securities..... $ 420,514 $ 324,100 $ 1,254,175 $ 1,464,175 $ 2,828,297
Cash reserved for satellite insurance............................................ – – – 82,393 122,068
Restricted cash and marketable investment securities................. 187,762 77,657 3,000 3,000 1,288
Total assets ................................................................................... 1,805,646 1,806,852 3,898,189 4,636,835 6,519,686
Long-term obligations (less current portion):
1994 Notes............................................................................... 499,863 571,674 1,503 – –
1996 Notes............................................................................... 438,512 497,955 1,097 – –
1997 Notes............................................................................... 375,000 375,000 15 – –
9 1/4% Seven Year Notes......................................................... – – 375,000 375,000 375,000
9 3/8% Ten Year Notes ............................................................ – – 1,625,000 1,625,000 1,625,000
10 3/8% Seven Year Notes....................................................... – – – 1,000,000 1,000,000
9 1/8% Seven Year Notes......................................................... – – – – 700,000
4 7/8% Convertible Notes......................................................... – – 1,000,000 1,000,000 1,000,000
5 3/4% Convertible Notes......................................................... – – – – 1,000,000
Mortgages and other notes payable, net of current portion .... 51,846 43,450 27,990 14,812 6,480
Series B Preferred Stock .............................................................. 199,164 226,038 – – –
Total stockholders’ equity (deficit) .............................................. (88,961) (371,540) (48,418) (657,383) (777,772)
Year Ended December 31,
1997 1998 1999 2000 2001
(In thousands, except subscribers and per subscriber data)
Other Data
DISH Network subscribers........................................ 1,040,000 1,940,000 3,410,000 5,260,000 6,830,000
Average monthly revenue per subscriber.................. $ 38.50 $ 39.25 $ 42.71 $ 45.33 $ 49.32
EBITDA(2)................................................................ (50,995) (20,255) (172,803) (187,245) 511,127
Less amortization of subscriber acquisition costs..... (121,735) (18,869) – – –
EBITDA, as adjusted to exclude amortization of
subscriber acquisition costs .................................. (172,730) (39,124) (172,803) (187,245) 511,127
Net cash flows from:
Operating activities............................................... 43 (16,890) (58,513) (118,677) 489,483
Investing activities ................................................ (597,249) (8,048) (62,826) (911,957) (1,279,119)
Financing activities............................................... 703,182 (13,722) 920,091 982,153 1,610,707
(1) The loss per share amount in 1999 of $(1.92) includes $(1.28) per share relating to basic and diluted loss per share before extraordinary charges
and $(0.64) per share relating to the extraordinary charge for early retirement of debt, net of tax.
(2) We believe it is common practice in the telecommunications industry for investment bankers and others to use various multiples of current or
projected EBITDA (operating income (loss) plus depreciation and amortization, and non-cash, stock-based compensation) for purposes of
estimating current or prospective enterprise value and as one of many measures of operating performance. Conceptually, EBITDA measures the
amount of income generated each period that could be used to service debt, because EBITDA is independent of the actual leverage employed by
the business; but EBITDA ignores funds needed for capital expenditures and expansion. Some investment analysts track the relationship of
EBITDA to total debt as one measure of financial strength. However, EBITDA does not purport to represent cash provided or used by operating
activities and should not be considered in isolation or as a substitute for measures of performance prepared in accordance with generally accepted
accounting principles.
EBITDA differs significantly from cash flows from operating activities reflected in the consolidated statement of cash flows. Cash flows from
operating activities is net of interest and taxes paid and is a more comprehensive determination of periodic income on a cash (vs. accrual) basis,
exclusive of non-cash items of income and expenses such as depreciation and amortization. In contrast, EBITDA is derived from accrual basis
income and is not reduced for cash invested in working capital. Consequently, EBITDA is not affected by the timing of receivable collections or
when accrued expenses are paid. We are not aware of any uniform standards for determining EBITDA and believe presentations of EBITDA
may not be calculated consistently by different entities in the same or similar businesses. EBITDA is shown before and after amortization of
subscriber acquisition costs, which were deferred through September 1997 and amortized over one year. EBITDA for 1999, 2000 and 2001 also
excludes approximately $61 million, $51 million and $20 million in non-cash, stock-based compensation expense resulting from significant post-
grant appreciation of stock options granted to employees, respectively. In addition, EBITDA does not include the impact of amounts capitalized
under our Digital Home Plan of approximately $65.4 million and $338 million during 2000 and 2001, respectively.