Dish Network 2001 Annual Report Download - page 37
Download and view the complete annual report
Please find page 37 of the 2001 Dish Network annual report below. You can navigate through the pages in the report by either clicking on the pages listed below, or by using the keyword search tool below to find specific information within the annual report.-
 1
1 -
2
-
3
-
4
-
5
-
6
-
7
-
8
-
9
-
10
-
11
-
12
-
13
-
14
-
15
-
16
-
17
-
18
-
19
-
20
-
21
-
22
-
23
-
24
-
25
-
26
-
 27
27 -
 28
28 -
 29
29 -
 30
30 -
 31
31 -
 32
32 -
 33
33 -
 34
34 -
 35
35 -
 36
36 -
 37
37 -
 38
38 -
 39
39 -
 40
40 -
 41
41 -
 42
42 -
 43
43 -
 44
44 -
 45
45 -
 46
46 -
 47
47 -
48
-
49
-
50
-
51
-
52
-
53
-
54
-
55
-
56
-
57
-
58
-
59
-
60
-
61
-
62
-
63
-
64
-
65
-
66
-
67
-
68
-
69
-
70
-
71
-
72
-
73
-
74
-
75
-
76
-
77
-
78
-
79
-
80
-
81
-
82
-
83
-
84
-
85
-
86
-
87
-
88
-
89
-
90
-
91
-
92
-
93
-
94
-
95
-
96
-
97
-
98
-
99
-
100
-
101
-
102
-
103
-
104
-
105
-
106
-
107
-
108
 |
 |

35
As of February 25, 2002, there were approximately 6,068 holders of record of our class A common stock,
not including stockholders who beneficially own class A common stock held in nominee or street name. As of
February 25, 2002, all 238,435,208 outstanding shares of our class B common stock were held by Charles W. Ergen,
our Chairman and Chief Executive Officer. There is currently no trading market for our class B common stock.
We have never declared or paid any cash dividends on any class of our common stock and do not expect to
declare dividends on our common stock in the foreseeable future. Payment of any future dividends will depend upon
our earnings and capital requirements, restrictions in our debt facilities, and other factors the Board of Directors
considers appropriate. We currently intend to retain our earnings, if any, to support future growth and expansion.
See “Management’s Discussion and Analysis of Financial Condition and Results of Operations – Liquidity and
Capital Resources.”
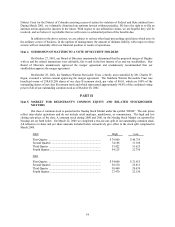
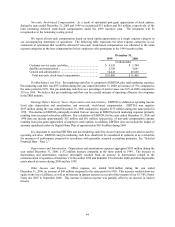
Item 6. SELECTED FINANCIAL DATA
The selected consolidated financial data as of and for each of the five years ended December 31, 2001 have
been derived from, and are qualified by reference to our Consolidated Financial Statements which have been audited by
Arthur Andersen LLP, independent public accountants. This data should be read in conjunction with our Consolidated
Financial Statements and related Notes thereto for the three years ended December 31, 2001, and “Management’s
Discussion and Analysis of Financial Condition and Results of Operations” included elsewhere in this report.
Year Ended December 31,
1997 1998 1999 2000 2001
Statements of Operations Data (In thousands, except per share data)
Revenue:
DISH Network........................................................ $ 344,250 $ 683,032 $ 1,352,603 $ 2,352,237 $ 3,605,724
DTH equipment sales and integration services ...... 91,637 256,193 184,041 259,830 271,242
Other........................................................................ 41,531 43,441 66,197 103,153 124,172
Total revenue ............................................................. 477,418 982,666 1,602,841 2,715,220 4,001,138
Costs and Expenses:
DISH Network operating expenses ........................ 193,274 395,411 732,675 1,265,445 1,757,750
Cost of sales – DTH equipment and integration
services ............................................................... 61,992 173,388 148,427 194,963 188,039
Cost of sales – other................................................ 23,909 16,496 17,084 32,992 81,974
Marketing expenses ................................................ 179,923 320,521 727,061 1,158,640 1,084,375
General and administrative ..................................... 69,315 97,105 150,397 250,425 377,873
Non-cash, stock-based compensation..................... – – 61,060 51,465 20,173
Depreciation and amortization................................ 173,276 102,636 113,228 185,356 278,652
Total costs and expenses............................................ 701,689 1,105,557 1,949,932 3,139,286 3,788,836
Operating income (loss)............................................. (224,271) (122,891) (347,091) (424,066) 212,302
Extraordinary charge for early retirement of debt,
net of tax............................................................. – – (268,999) – –
Net loss....................................................................... $ (312,825) $ (260,882) $ (792,847) $ (650,326) (215,498)
Net loss attributable to common shares..................... $ (321,267) $ (296,097) $ (800,100) $ (651,472) (215,835)
Weighted-average common shares outstanding........ 335,344 359,856 416,476 471,023 477,172
Basic and diluted loss per share (1)........................... $ (0.96) $ (0.82) $ (1.92) $ (1.38) $ (0.45)