Dish Network 2001 Annual Report Download - page 46
Download and view the complete annual report
Please find page 46 of the 2001 Dish Network annual report below. You can navigate through the pages in the report by either clicking on the pages listed below, or by using the keyword search tool below to find specific information within the annual report.-
 1
1 -
2
-
3
-
4
-
5
-
6
-
7
-
8
-
9
-
10
-
11
-
12
-
13
-
14
-
15
-
16
-
17
-
18
-
19
-
20
-
21
-
22
-
23
-
24
-
25
-
26
-
27
-
28
-
29
-
30
-
31
-
32
-
33
-
34
-
35
-
 36
36 -
 37
37 -
 38
38 -
 39
39 -
 40
40 -
 41
41 -
 42
42 -
 43
43 -
 44
44 -
 45
45 -
 46
46 -
 47
47 -
 48
48 -
 49
49 -
 50
50 -
 51
51 -
 52
52 -
 53
53 -
 54
54 -
 55
55 -
 56
56 -
57
-
58
-
59
-
60
-
61
-
62
-
63
-
64
-
65
-
66
-
67
-
68
-
69
-
70
-
71
-
72
-
73
-
74
-
75
-
76
-
77
-
78
-
79
-
80
-
81
-
82
-
83
-
84
-
85
-
86
-
87
-
88
-
89
-
90
-
91
-
92
-
93
-
94
-
95
-
96
-
97
-
98
-
99
-
100
-
101
-
102
-
103
-
104
-
105
-
106
-
107
-
108
 |
 |

44
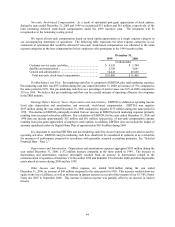
Non-cash, Stock-based Compensation. As a result of substantial post-grant appreciation of stock options,
during the years ended December 31, 2000 and 1999 we recognized $51 million and $61 million, respectively, of the
total remaining deferred stock-based compensation under the 1999 incentive plan. The remainder will be
recognized over the remaining vesting period.
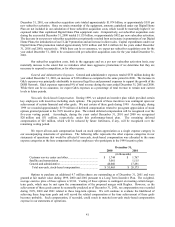
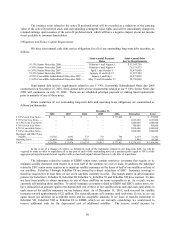
We report all non-cash compensation based on stock option appreciation as a single expense category in
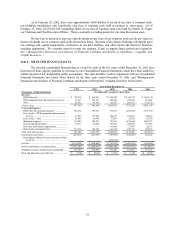
our accompanying statements of operations. The following table represents the other expense categories in our
statements of operations that would be affected if non-cash, stock-based compensation was allocated to the same
expense categories as the base compensation for key employees who participate in the 1999 incentive plan:
December 31,
1999 2000
(in thousands)
Customer service center and other........................................ $ 4,328 $ 1,744
Satellite and transmission .................................................... 2,308 3,061
General and administrative .................................................. 54,424 46,660
Total non-cash, stock-based compensation........................ $ 61,060 $ 51,465
Pre-Marketing Cash Flow. Pre-marketing cash flow is comprised of EBITDA plus total marketing expenses.
Pre-marketing cash flow was $971 million during the year ended December 31, 2000, an increase of 75% compared to
the same period in 1999. Our pre-marketing cash flow as a percentage of total revenue was 36% in 2000 compared to
35% in 1999. We believe that pre-marketing cash flow can be a useful measure of operating efficiency for companies
in the DBS industry.
Earnings Before Interest, Taxes, Depreciation and Amortization. EBITDA is defined as operating income
(loss) plus depreciation and amortization, and non-cash, stock-based compensation. EBITDA was negative
$187 million during the year ended December 31, 2000 compared to negative $173 million during the same period in
1999. This decline in EBITDA principally resulted from an increase in DISH Network marketing expenses primarily
resulting from increased subscriber additions. Our calculation of EBITDA for the years ended December 31, 2000 and
1999 does not include approximately $51 million and $61 million, respectively, of non-cash compensation expense
resulting from post-grant appreciation of employee stock options. In addition, EBITDA does not include the impact of
amounts capitalized under our Digital Home Plan of approximately $65.4 million during 2000.
It is important to note that EBITDA and pre-marketing cash flow do not represent cash provided or used by
operating activities. EBITDA and pre-marketing cash flow should not be considered in isolation or as a substitute
for measures of performance prepared in accordance with generally accepted accounting principles. See “Selected
Financial Data – Note 2.”
Depreciation and Amortization. Depreciation and amortization expenses aggregated $185 million during the
year ended December 31, 2000, a $72 million increase compared to the same period in 1999. The increase in
depreciation and amortization expenses principally resulted from an increase in depreciation related to the
commencement of operation of EchoStar V in November 1999 and EchoStar VI in October 2000 and other depreciable
assets placed in service during 2000 and late 1999.
Other Income and Expense. Other expense, net, totaled $226 million during the year ended
December 31, 2000, an increase of $49 million compared to the same period in 1999. This increase resulted from our
equity in the loss of affiliates, as well as an increase in interest expense as a result of the issuance of our 10 3/8% Senior
Notes due 2007 in September 2000. This increase in interest expense was partially offset by an increase in interest
income.