Dish Network 1997 Annual Report Download - page 85
Download and view the complete annual report
Please find page 85 of the 1997 Dish Network annual report below. You can navigate through the pages in the report by either clicking on the pages listed below, or by using the keyword search tool below to find specific information within the annual report.-
 1
1 -
2
-
3
-
4
-
5
-
6
-
7
-
8
-
9
-
10
-
11
-
12
-
13
-
14
-
15
-
16
-
17
-
18
-
19
-
20
-
21
-
22
-
23
-
24
-
25
-
26
-
27
-
28
-
29
-
30
-
31
-
32
-
33
-
34
-
35
-
36
-
37
-
38
-
39
-
40
-
41
-
42
-
43
-
44
-
45
-
46
-
47
-
48
-
49
-
50
-
51
-
52
-
53
-
54
-
55
-
56
-
57
-
58
-
59
-
60
-
61
-
62
-
63
-
64
-
65
-
66
-
67
-
68
-
69
-
70
-
71
-
72
-
73
-
74
-
 75
75 -
 76
76 -
 77
77 -
 78
78 -
 79
79 -
 80
80 -
 81
81 -
 82
82 -
 83
83 -
 84
84 -
 85
85 -
 86
86 -
 87
87
 |
 |

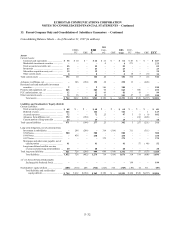
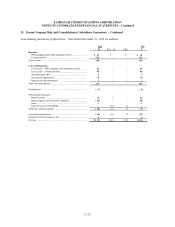
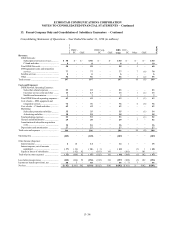
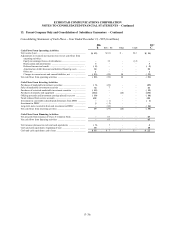
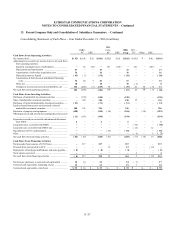
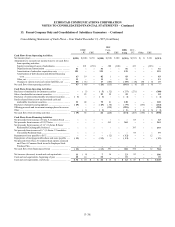
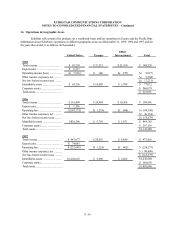
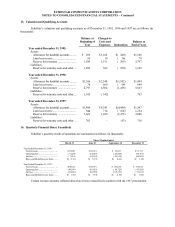
ECHOSTAR COMMUNICATIONS CORPORATION
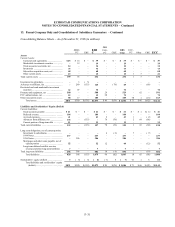
NOTES TO CONSOLIDATED FINANCIAL STATEMENTS – Continued
13. Parent Company Only and Consolidation of Subsidiary Guarantors − Continued
F–38
Consolidating Statements of Cash Flows − Year Ended December 31, 1997 (in millions)
ESBC
- PC C&E
DBS
Corp-
PC C&E
DBS
Corp
ECC -
PC Other C&E
Cash Flows From Operating Activities:
Net income (loss)................................ ................................ ........ $(291) $(308) $ 291 $(308) $(318) $ 308 $(318) $(313) $( 3) $ 321 $(313)
Adjustments to reconcile net income (loss) to net cash flows
from operating activities:
Equity in (earnings) losses of subsidiaries ........................... –291 (291) –308 (308) –323 –(323) –
Depreciation and amortization ................................ ............. 51 – – 51 – – 51 –––51
Amortization of subscriber acquisition costs ...................... 121 – – 121 – – 121 –––121
Amortization of debt discount and deferred financing
costs................................ ................................ ................... 63 19 –82 1–83 –––83
Other, net ................................ ................................ ............... 11 – – 11 – – 11 –––11
Changes in current assets and current liabilities, net .......... 88 ( 71) –17 (106) –( 89)
( 18))
158 ( 4) 47
Net cash flows from operating activities ................................ .. 43 ( 69) –( 26) (115) –(141) ( 8) 155 ( 6) –
Cash Flows From Investing Activities:
Purchases of marketable investment securities ........................ –( 5) –( 5) ( 32) –( 37) (271) – – (308)
Sales of marketable investment securities ................................ –23 –23 29 –52 –––52
Purchases of restricted marketable investment securities ........ ( 1) – – ( 1) – – ( 1) –––( 1)
Funds released from escrow and restricted cash and
marketable investment securities ................................ ......... 31 48 –79 41 –120 –––120
Purchases of property and equipment ................................ ....... ( 49) – – ( 49) ( 30) –( 79) –(153) –(232)
Offering proceeds and investment earnings placed in escrow ––––(228) –(228) –––(228)
Other................................ ................................ ............................ –( 1) –( 1) – – ( 1) 8( 2) ( 6) ( 1)
Net cash flows from investing activities ................................ ... ( 19) 65 –46 (220) –(174) (263) (155) ( 6) (598)
Cash Flows From Financing Activities:
Net proceeds from issuance of Class A Common Stock ......... –––––––63 – – 63
Net proceeds from issuance of 1997 Notes .............................. – – – – 363 –363 –––363
Net proceeds from issuance of 12 1/8% Series B Senior
Redeemable Exchangeable Preferred ................................ .... –––––––193 – – 193
Net proceeds from issuance of 6 3/4% Series C Cumulative
Convertible Preferred Stock ................................ ................... –––––––97 – – 97
Repayment of note payable to ECC ................................ .......... ––––( 12) –( 12) – – 12 –
Repayments of mortgage indebtedness and notes payable ...... ( 13) – – ( 13) – – ( 13) –––( 13)
Net proceeds from Class A Common Stock options exercised
and Class A Common Stock issued to Employee Stock
Purchase Plan ................................ ................................ ......... –––––––1– – 1
Net cash flows from financing activities ................................ .. ( 13) – – ( 13) 351 –338 354 –12 704
Net increase (decrease) in cash and cash equivalents .............. 11 ( 4) –716 –23 83 – – 106
Cash and cash equivalents, beginning of year .......................... 25 14 –39 – – 39 –––39
Cash and cash equivalents, end of year ................................ ..... $ 36 $ 10 $ – $ 46 $ 16 $ – $ 62 $ 83 $ – $ – $ 145