Dish Network 1997 Annual Report Download - page 30
Download and view the complete annual report
Please find page 30 of the 1997 Dish Network annual report below. You can navigate through the pages in the report by either clicking on the pages listed below, or by using the keyword search tool below to find specific information within the annual report.-
 1
1 -
2
-
3
-
4
-
5
-
6
-
7
-
8
-
9
-
10
-
11
-
12
-
13
-
14
-
15
-
16
-
17
-
18
-
19
-
 20
20 -
 21
21 -
 22
22 -
 23
23 -
 24
24 -
 25
25 -
 26
26 -
 27
27 -
 28
28 -
 29
29 -
 30
30 -
 31
31 -
 32
32 -
 33
33 -
 34
34 -
 35
35 -
 36
36 -
 37
37 -
 38
38 -
 39
39 -
 40
40 -
41
-
42
-
43
-
44
-
45
-
46
-
47
-
48
-
49
-
50
-
51
-
52
-
53
-
54
-
55
-
56
-
57
-
58
-
59
-
60
-
61
-
62
-
63
-
64
-
65
-
66
-
67
-
68
-
69
-
70
-
71
-
72
-
73
-
74
-
75
-
76
-
77
-
78
-
79
-
80
-
81
-
82
-
83
-
84
-
85
-
86
-
87
 |
 |

28
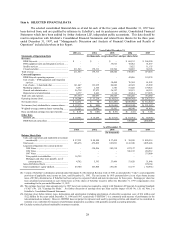
Item 6. SELECTED FINANCIAL DATA
The selected consolidated financial data as of and for each of the five years ended December 31, 1997 have
been derived from, and are qualified by reference to, EchoStar’s, and its predecessor entities, Consolidated Financial
Statements which have been audited by Arthur Andersen LLP, independent public accountants. This data should be
read in conjunction with EchoStar’s Consolidated Financial Statements and related Notes thereto for the three years
ended December 31, 1997, and “ Management’s Discussion and Analysis of Financial Condition and Results of
Operations” included elsewhere in this Report.
Years Ended December 31,
1993 (1) 1994 1995 1996 1997
Statements of Operations Data (In thousands, except subscribers and per share data)
Revenue:
DISH Network........................................................ $ – $ – $ – $ 60,132 $ 344,250
DTH equipment sales and integration services ...... – – 35,816 78,062 91,637
Satellite services...................................................... –––5,822 11,135
C-band and other..................................................... 211,563 179,313 112,704 54,885 30,396
Total revenue ............................................................. 211,563 179,313 148,520 198,901 477,418
Costs and Expenses:
DISH Network operating expenses ........................ –––42,456 193,274
Cost of sales – DTH equipment and integration
services ............................................................... – – 30,404 76,384 61,992
Cost of sales – C-band and other ............................ 161,447 133,635 84,846 42,349 23,909
Marketing expenses ................................................ 3,497 2,346 1,786 51,520 179,923
General and administrative..................................... 26,738 27,873 36,397 52,123 69,315
Depreciation and amortization................................ 1,677 2,243 3,114 43,414 173,276
Total costs and expenses............................................ 193,359 166,097 156,547 308,246 701,689
Operating income (loss)............................................. $ 18,204 $ 13,216 $( 8,027) $(109,345) $( 224,271)
Net income (loss)....................................................... $ 12,272 $ 90 $(11,486) $(100,986) $( 312,825)
Net income (loss) attributable to common shares ..... $ 12,272 $( 849) $(12,690) $(102,190) $( 321,267)
Weighted-average common shares outstanding........ 32,221 32,442 35,562 40,548 41,918
Basic and diluted earnings (loss) per share (2).......... $ 0.38 $( 0.03) $( 0.36) $( 2.52) $( 7.66)
Other Data
EBITDA (3) ............................................................ $ 19,881 $ 15,459 $( 4,913) $( 65,931) $( 50,995)
DISH Network subscribers ..................................... –––350,000 1,040,000
As of December 31,
1993 1994 1995 1996 1997
(In thousands)
Balance Sheets Data
Cash, cash equivalents and marketable investment
securities (4) ....................................................... $ 27,232 $ 48,544 $ 37,424 $ 58,038 $ 420,514
Total assets.............................................................. 106,476 472,492 623,091 1,141,380 1,805,646
Long-term obligations (less current portion):
1994 Notes ......................................................... –334,206 382,218 437,127 499,863
1996 Notes ......................................................... – – – 386,165 438,512
1997 Notes ......................................................... – – – – 375,000
Note payable to stockholder............................... 14,725 – – – –
Mortgages and other notes payable, net of
current portion ............................................... 4,702 5,393 33,444 51,428 51,846
Series B Preferred Stock......................................... – – – – 199,164
Total stockholders’ equity (deficit)......................... 49,700 103,808 156,686 61,197 ( 88,961)
(1) Certain of EchoStar’s subsidiaries operated under Subchapter S of the Internal Revenue Code of 1986, as amended (the “Code” ), and comparable
provisions of applicable state income tax laws, until December 31, 1993. The net income for 1993 presented above is net of pro forma income
taxes of $7,846, determined as if EchoStar had been subject to corporate Federal and state income taxes for those years. Earnings per share has
been calculated and presented on a pro forma basis as if the shares of EchoStar issued to reflect the December 31, 1993 reorganization were
outstanding for the year ended December 31, 1993.
(2) The earnings (loss) per share amounts prior to 1997 have been restated as required to comply with Statement of Financial Accounting Standards
(“ FAS” ) No. 128, “Earnings Per Share.” For further discussion of earnings (loss) per share and the impact of FAS No. 128, see Note 2 to
EchoStar’s Consolidated Financial Statements.
(3) Earnings (loss) before interest, taxes, depreciation and amortization (including amortization of subscriber acquisition costs of $16 million and
$122 million for the years ended December 31, 1996 and 1997, respectively) (“ EBITDA” ) is a commonly used measure of performance in the
telecommunications industry. However, EBITDA does not purport to represent cash used by operating activities and should not be considered in
isolation or as a substitute for measures of performance prepared in accordance with generally accepted accounting principles.
(4) Excludes restricted cash and marketable investment securities.