DHL 2000 Annual Report Download - page 7
Download and view the complete annual report
Please find page 7 of the 2000 DHL annual report below. You can navigate through the pages in the report by either clicking on the pages listed below, or by using the keyword search tool below to find specific information within the annual report.-
 1
1 -
 2
2 -
 3
3 -
 4
4 -
 5
5 -
 6
6 -
 7
7 -
 8
8 -
 9
9 -
 10
10 -
 11
11 -
 12
12 -
 13
13 -
 14
14 -
 15
15 -
 16
16 -
 17
17 -
 18
18 -
19
-
20
-
21
-
22
-
23
-
24
-
25
-
26
-
27
-
28
-
29
-
30
-
31
-
32
-
33
-
34
-
35
-
36
-
37
-
38
-
39
-
40
-
41
-
42
-
43
-
44
-
45
-
46
-
47
-
48
-
49
-
50
-
51
-
52
-
53
-
54
-
55
-
56
-
57
-
58
-
59
-
60
-
61
-
62
-
63
-
64
-
65
-
66
-
67
-
68
-
69
-
70
-
71
-
72
-
73
-
74
-
75
-
76
-
77
-
78
-
79
-
80
-
81
-
82
-
83
-
84
-
85
-
86
-
87
-
88
-
89
-
90
-
91
-
92
-
93
-
94
-
95
-
96
-
97
-
98
-
99
-
100
-
101
-
102
-
103
-
104
-
105
-
106
-
107
-
108
-
109
-
110
-
111
-
112
-
113
-
114
-
115
-
116
-
117
-
118
-
119
-
120
-
121
-
122
-
123
-
124
-
125
-
126
-
127
-
128
-
129
-
130
-
131
-
132
-
133
-
134
-
135
-
136
-
137
-
138
-
139
-
140
-
141
-
142
-
143
-
144
-
145
-
146
-
147
-
148
-
149
-
150
-
151
-
152
 |
 |

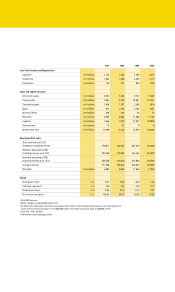
1997 1998 1999 2000
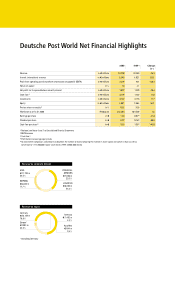
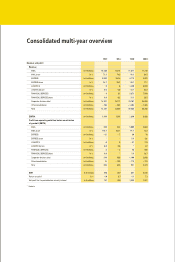
Consolidated multi-year overview
Revenue and profit
Revenue
MAIL in
€
millions 10,788 11,272 11,671 11,733
MAIL share in % 75.3 74.3 49.1 34.5
EXPRESS in
€
millions 3,533 3,818 4,775 6,022
EXPRESS share in % 24.7 25.2 20.1 17.7
LOGISTICS in
€
millions 0 0 4,450 8,289
LOGISTICS share in % 0.0 0.0 18.7 24.3
FINANCIAL SERVICES in
€
millions 0 81 2,871 7,990
FINANCIAL SERVICES share in % 0.0 0.5 12.1 23.5
Corporate divisions total in
€
millions 14,321 15,171 23,767 34,034
Other/consolidation in
€
millions – 189 – 502 – 1,404 – 1,326
Total in
€
millions 14,132 14,669 22,363 32,708
EBITDA in
€
millions 1,299 1,554 1,830 3,426
Profit from operating activities, before amortization
of goodw ill (EBITA)
MAIL in
€
millions 599 944 1,009 2,004
MAIL share in % 110.1 101.1 91.7 74.3
EXPRESS in
€
millions – 55 – 7 60 76
EXPRESS share in % * * 5.5 2.8
LOGISTICS in
€
millions 0 0 – 27 113
LOGISTICS share in % 0.0 0.0 * 4.2
FINANCIAL SERVICES in
€
millions 0 – 4 58 505
FINANCIAL SERVICES share in % 0.0 * 5.3 18.7
Corporate divisions total in
€
millions 544 933 1,100 2,698
Other/consolidation in
€
millions 15 – 100 – 179 – 319
Total in
€
millions 559 833 921 2,379
EBIT in
€
millions 556 827 851 2,235
Return on sales1) in % 4.0 5.7 4.1 7.3
Net profit for the period before minority interest in
€
millions 751 925 1,029 1,527
* No data