Chili's 2002 Annual Report Download - page 5
Download and view the complete annual report
Please find page 5 of the 2002 Chili's annual report below. You can navigate through the pages in the report by either clicking on the pages listed below, or by using the keyword search tool below to find specific information within the annual report.-
 1
1 -
 2
2 -
 3
3 -
 4
4 -
 5
5 -
 6
6 -
 7
7 -
 8
8 -
 9
9 -
 10
10 -
 11
11 -
 12
12 -
 13
13 -
 14
14 -
 15
15 -
 16
16 -
17
-
18
-
19
-
20
-
21
-
22
-
23
-
24
-
25
-
26
-
27
-
28
-
29
-
30
-
31
-
32
-
33
-
34
-
35
-
36
-
37
-
38
-
39
-
40
-
41
-
42
-
43
-
44
-
45
-
46
-
47
-
48
-
49
-
50
-
51
-
52
-
53
-
54
-
55
-
56
-
57
-
58
-
59
-
60
-
61
 |
 |

4
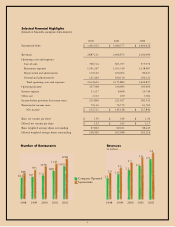
Selected Financial Highlights
(Amounts in thousands, except per share amounts)
2002 2001 2000
Systemwide Sales $ 3,401,652 $ 3,040,377 $ 2,660,429
Revenues 2,887,111 2,406,874 2,100,496
Operating costs and expenses:
Cost of sales 796,714 663,357 575,570
Restaurant expenses 1,591,367 1,303,349 1,138,487
Depreciation and amortization 130,102 100,064 90,647
General and administrative 121,420 109,110 100,123
Total operating costs and expenses 2,639,603 2,175,880 1,904,827
Operating Income 247,508 230,994 195,669
Interest expense 13,327 8,608 10,746
Other, net 2,332 459 3,381
Income before provision for income taxes 231,849 221,927 181,542
Provision for income taxes 79,136 76,779 63,702
Net income $ 152,713 $ 145,148 $ 117,840
Basic net income per share $ 1.56 $ 1.46 $ 1.20
Diluted net income per share $ 1.52 $ 1.42 $ 1.17
Basic weighted average shares outstanding 97,862 99,101 98,445
Diluted weighted average shares outstanding 100,565 102,098 101,114
Number of Restaurants Revenues
(in billions)
1998 1999 2000 2001 2002 1998
1.9
1268
1.5
624 707 774
899
1039
1.8
2.1
2.4
2.9
2.3
2.7
3.0
3.4
1999 2000 2001 2002
1143
1038
933
806
Company Operated
Systemwide