Airtran 2002 Annual Report Download - page 44
Download and view the complete annual report
Please find page 44 of the 2002 Airtran annual report below. You can navigate through the pages in the report by either clicking on the pages listed below, or by using the keyword search tool below to find specific information within the annual report.-
 1
1 -
2
-
3
-
4
-
5
-
6
-
7
-
8
-
9
-
10
-
11
-
12
-
13
-
14
-
15
-
16
-
17
-
18
-
19
-
20
-
21
-
22
-
23
-
24
-
25
-
26
-
27
-
28
-
29
-
30
-
31
-
32
-
33
-
 34
34 -
 35
35 -
 36
36 -
 37
37 -
 38
38 -
 39
39 -
 40
40 -
 41
41 -
 42
42 -
 43
43 -
 44
44 -
 45
45 -
 46
46 -
 47
47 -
 48
48 -
 49
49 -
 50
50 -
 51
51
 |
 |

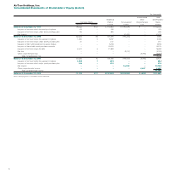
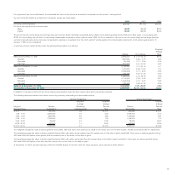
For purposes of pro forma disclosures, the estimated fair value of the options is amortized to expense over the options’ vesting period.
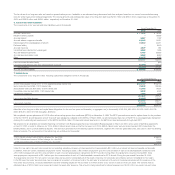
Our pro forma information is as follows (in thousands, except per share data):
2002 2001 2000
Pro forma net income (loss) $5,742 ($6,136) $45,059
Pro forma earnings (loss) per common share:
Basic $0.08 ($0.09) $0.69
Diluted $0.08 ($0.09) $0.65
The pro forma net income (loss) and earnings (loss) per common share information presented above reflect stock options granted during 1995 and in later years, in accordance with
SFAS 123. Accordingly, the full effect of calculating compensation expense for stock options under SFAS 123 is not reflected in the pro forma net income (loss) and earnings (loss) per
common share amounts above, because compensation expense is recognized over the stock option’s vesting period and compensation expense for stock options granted prior to
January 1, 1995, is not considered.
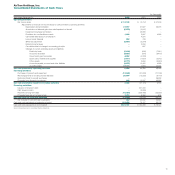
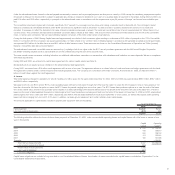
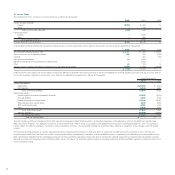
A summary of stock option activity under the aforementioned plans is as follows:
Weighted-
Average
Options Price Range Price
Balance at December 31, 1999 8,640,520 $ 0.17–23.19 $4.16
Granted 1,097,500 4.00– 4.75 4.28
Exercised (63,000) 0.17– 3.88 3.02
Canceled (570,760) 3.31 – 21.50 5.46
Balance at December 31, 2000 9,104,260 0.17–23.19 4.17
Granted 1,721,600 6.08–11.00 7.14
Exercised (1,459,656) 0.17– 8.25 3.48
Canceled (100,365) 4.00 – 21.38 6.59
Balance at December 31, 2001 9,265,839 0.17 –23.19 4.79
Granted 2,114,829 2.78– 9.05 6.47
Exercised (1,405,253) 0.17– 5.75 0.58
Canceled (190,426) 3.88 – 21.38 6.02
Balance at December 31, 2002 9,784,989 0.17 – 23.19 5.73
Exercisable at December 31, 2002 6,890,331 $0.17 – 23.19 $5.53
In addition to the above, 500 common stock awards were granted under the stock option plans and concurrently exercised.
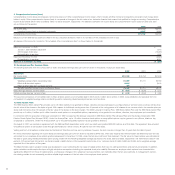
The following table summarizes information concerning currently outstanding and exercisable options:
Options Outstanding Options Exercisable
Weighted- Weighted- Weighted-
Average Average Average
Range of Number Remaining Exercise Number Exercise
Exercise Prices Outstanding Contractual Life Price Exercisable Price
$ 0.17 620,000 0.5 $ 0.17 620,000 $ 0.17
1.00– 4.00 3,695,800 5.5 3.33 2,848,467 3.18
4.03– 5.97 1,985,093 6.5 4.85 1,475,930 4.84
6.08– 9.12 2,756,496 8.6 7.55 1,238,334 7.12
9.30–13.25 85,000 4.5 11.93 65,000 12.48
18.38–23.19 642,600 3.1 18.96 642,600 18.96
$ 0.17–23.19 9,784,989 6.1 $ 5.73 6,890,331 $ 5.53
The weighted-average fair value of options granted during 2002, 2001 and 2000, with option prices equal to the market price on the date of grant, was $2.48, $4.22 and $2.45, respectively.
The weighted-average fair value of options granted during 2002, with option prices greater than the market price on the date of grant was $2.86. There were no options granted during
2001 and 2000 with option prices greater than the market price of the stock on the date of grant.
The weighted-average fair value of options granted during 2002, with option prices less than the market price on the date of grant was $4.60. There were no options granted during
2001 and 2000 with option prices less than the market price of the stock on the date of grant.
At December 31, 2002, we had reserved a total of 8,445,852 shares of common stock for future issuance, upon exercise of stock options.
23