Airtran 2002 Annual Report Download - page 23
Download and view the complete annual report
Please find page 23 of the 2002 Airtran annual report below. You can navigate through the pages in the report by either clicking on the pages listed below, or by using the keyword search tool below to find specific information within the annual report.-
 1
1 -
2
-
3
-
4
-
5
-
6
-
7
-
8
-
9
-
10
-
11
-
12
-
 13
13 -
 14
14 -
 15
15 -
 16
16 -
 17
17 -
 18
18 -
 19
19 -
 20
20 -
 21
21 -
 22
22 -
 23
23 -
 24
24 -
 25
25 -
 26
26 -
 27
27 -
 28
28 -
 29
29 -
 30
30 -
 31
31 -
 32
32 -
 33
33 -
34
-
35
-
36
-
37
-
38
-
39
-
40
-
41
-
42
-
43
-
44
-
45
-
46
-
47
-
48
-
49
-
50
-
51
 |
 |

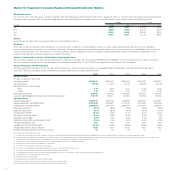
Market Information
Our common stock, $.001 par value, is traded on the New York Stock Exchange under the symbol “AAI.” Prior to August 15, 2001, our common stock was traded on the American Stock
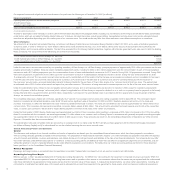
Exchange under the symbol “AAI.” The following table sets forth the reported high and low sale prices for our common stock for each quarterly period during 2002 and 2001:
2002 2001
Quarter High Low High Low
1st $7.45 $5.31 $10.40 $6.50
2nd $6.32 $5.00 $12.25 $7.50
3rd $5.54 $2.34 $10.56 $2.60
4th $4.50 $2.51 $ 7.18 $3.50
Holders
As of February 28, 2003, there were approximately 5,251 stockholders of record.
Dividends
Historically, we have not declared cash dividends on our common stock. In addition, our debt indentures restrict our ability to pay cash dividends. We intend to retain earnings to
finance the development and growth of our business. Accordingly, we do not anticipate that any dividends will be declared on our common stock for the foreseeable future. Future pay-
ments of cash dividends, if any, will depend on our financial condition, results of operations, business conditions, capital requirements, restrictions contained in agreements, future
prospects and other factors deemed relevant by our Board of Directors.
Securities Authorized for Issuance Under Equity Compensation Plans
The information required by this Item is incorporated herein by reference to the data under the heading “SECURITIES AUTHORIZED” in the Proxy Statement to be used in connection
with the solicitation of proxies for our annual meeting of stockholders to be held May 14, 2003, which Proxy statement is to be filed with the Commission.
Selected Financial and Operating Data
The following financial information for the five years ended December 31, 2002 has been derived from our consolidated financial statements. This information should be read in
conjunction with the consolidated financial statements and related Notes thereto included elsewhere herein.
2002 2001 2000 1999 1998
Financial Data:
(in 000s, except per share data)
Operating revenues $733,370 $665,164 $624,094 $523,468 $439,307
Net income (loss) 10,745(1) (2,757)(2) 47,436 (99,394)(3) (40,738)(4)
Earnings (loss) per common share:
Basic 0.15 (0.04) 0.72 (1.53) (0.63)
Diluted 0.15 (0.04) 0.69 (1.53) (0.63)
Total assets at year-end 473,450 497,816 546,255 467,014 376,406
Long-term debt obligations including current maturities at year-end 210,173 268,211 427,903 415,688 245,994
Operating Data:
Revenue passengers 9,653,777 8,302,732 7,566,986 6,460,533 5,462,827
Revenue passenger miles (RPM) (000s)(5) 5,581,263 4,506,007 4,115,745 3,473,490 3,244,539
Available seat miles (ASM) (000s)(6) 8,255,809 6,537,756 5,859,395 5,467,556 5,442,234
Passenger load factor(7) 67.6% 68.9% 70.2% 63.5% 59.6%
Break-even load factor(8) 66.7% 66.3% 64.7% 59.4% 61.5%
Average yield per RPM(9) 12.79¢ 14.39¢ 14.70¢ 14.01¢ 12.97¢
Passenger revenue per ASM(10) 8.64¢ 9.92¢ 10.32¢ 8.90¢ 7.73¢
Operating cost per ASM(11) 8.51¢ 9.33¢ 9.27¢ 8.19¢ 7.91¢
Operating cost per ASM, excluding aircraft fuel(12) 6.64¢ 7.20¢ 6.87¢ 6.94¢ 6.59¢
Average stage length (miles) 567 541 537 528 546
Average cost of aircraft fuel per gallon 90.37¢ 93.85¢ 100.89¢ 49.95¢ 54.87¢
Average daily utilization (hours:minutes)(13) 10:36 9:54 10:18 9:54 9:42
Number of operating aircraft in fleet at end of period 65 59 53 47 50
Note: All special items listed below are pre-tax.
(1) Includes a $0.6 million grant from the U.S. government pursuant to the Air Transportation Safety and System Stabilization Act (the Stabilization Act), and the cumulative effect of a change in accounting principle of $0.7 million
(2) Includes a $28.0 million impairment loss related to our DC-9 fleet, an $18.1 million impairment loss/lease termination charge related to our retired B737 fleet, special charges of $2.5 million incurred during the federal ground stop order, a $29.0 million
grant from the U.S. government pursuant to the Stabilization Act, and the cumulative effect of a change in accounting principle of $0.7 million
(3) Includes a $147.7 million impairment loss related to our DC-9 fleet and a gain of $19.6 million for a litigation settlement
(4) Includes a $27.5 million impairment loss related to our B737 aircraft
(5) The number of scheduled revenue miles flown by passengers
(6) The number of seats available for passengers multiplied by the number of scheduled miles each seat is flown
(7) The percentage of aircraft seating capacity that is actually utilized (RPMs divided by ASMs)
(8) The percentage of seats that must be occupied by revenue passengers in order for us to break even on a pre-tax income basis, excluding special items
(9) The average amount one passenger pays to fly one mile
(10) Passenger revenue divided by ASMs
(11) Operating expenses, excluding special items, divided by ASMs
(12) Operating expenses, excluding aircraft fuel expense and special items, divided by ASMs
(13) The average amount of time per day that an aircraft flown is operated in revenue service
2
Market for Registrant’s Common Equity and Related Stockholder Matters