Aflac 2013 Annual Report Download - page 33
Download and view the complete annual report
Please find page 33 of the 2013 Aflac annual report below. You can navigate through the pages in the report by either clicking on the pages listed below, or by using the keyword search tool below to find specific information within the annual report.-
 1
1 -
2
-
3
-
4
-
5
-
6
-
7
-
8
-
9
-
10
-
11
-
12
-
13
-
14
-
15
-
16
-
17
-
18
-
19
-
20
-
21
-
22
-
 23
23 -
 24
24 -
 25
25 -
 26
26 -
 27
27 -
 28
28 -
 29
29 -
 30
30 -
 31
31 -
 32
32 -
 33
33 -
 34
34 -
 35
35 -
 36
36 -
 37
37 -
 38
38 -
 39
39 -
 40
40
 |
 |

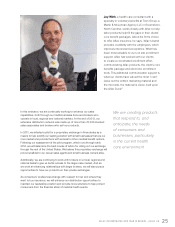
At the same time, Aflac’s Global Investment Division further spread its wings by continuing its multi-year
transformation project. This resulted in greater investment capabilities, the addition of key personnel in both
Tokyo and New York, and the selection of a new investment technology platform.
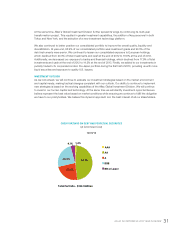
We also continued to better position our consolidated portfolio to improve the overall quality, liquidity and
diversification. At year-end, 95.9% of our consolidated portfolio was investment grade and 93.5% of the
debt instruments were senior. We continued to lessen our consolidated exposure to European holdings,
which declined from 20.0% of total investments and cash at the end of 2012 to 16.6% at the end of 2013.
Additionally, we decreased our exposure to banks and financial holdings, which declined from 17.9% of total
investments and cash at the end of 2012 to 14.2% at the end of 2013. Finally, we added to our investments in
publicly traded U.S. corporate bonds in the Japan portfolio during the first half of 2013, providing us with more
liquid securities and exposure to quality U.S. issuers.
INVESTMENT OUTLOOK
As we look ahead, we will continue to evaluate our investment strategies based on the market environment
and capital needs, making tactical changes consistent with our outlook. Our ability to continue to implement
new strategies is based on the evolving capabilities of the Aflac Global Investment Division. We will continue
to invest in our human capital and technology. At the same time we will identify investment opportunities we
believe represent the best value based on market conditions while ensuring we continue to fulfill the obligation
we have to our policyholders. We believe this dynamic approach is in the best interest of all our stakeholders.
CREDIT RATINGS ON DEBT AND PERPETUAL SECURITIES
(at Amortized Cost)
12/31/13
Total Portfolio - $103.9 Billion
AAA
AA
A
BBB
BB or Lower
46.7%
24.4%
23.4%
4.1% 1.4%
AFLAC INCORPORATED 2013 YEAR IN REVIEW 31