Aflac 2013 Annual Report Download - page 11
Download and view the complete annual report
Please find page 11 of the 2013 Aflac annual report below. You can navigate through the pages in the report by either clicking on the pages listed below, or by using the keyword search tool below to find specific information within the annual report.-
 1
1 -
 2
2 -
 3
3 -
 4
4 -
 5
5 -
 6
6 -
 7
7 -
 8
8 -
 9
9 -
 10
10 -
 11
11 -
 12
12 -
 13
13 -
 14
14 -
 15
15 -
 16
16 -
 17
17 -
 18
18 -
 19
19 -
 20
20 -
 21
21 -
 22
22 -
23
-
24
-
25
-
26
-
27
-
28
-
29
-
30
-
31
-
32
-
33
-
34
-
35
-
36
-
37
-
38
-
39
-
40
 |
 |
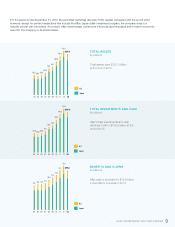
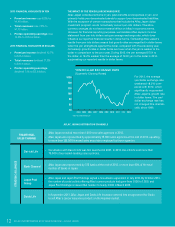
For the period ended December 31, 2013, the yen/dollar exchange rate was 17.9% weaker compared with the end of 2012.
However, except for certain transactions that include the Aflac Japan dollar investment program, the company does not
actually convert yen into dollars. As a result, Aflac views foreign currency as a financial reporting issue and not as an economic
event for the company or its shareholders.
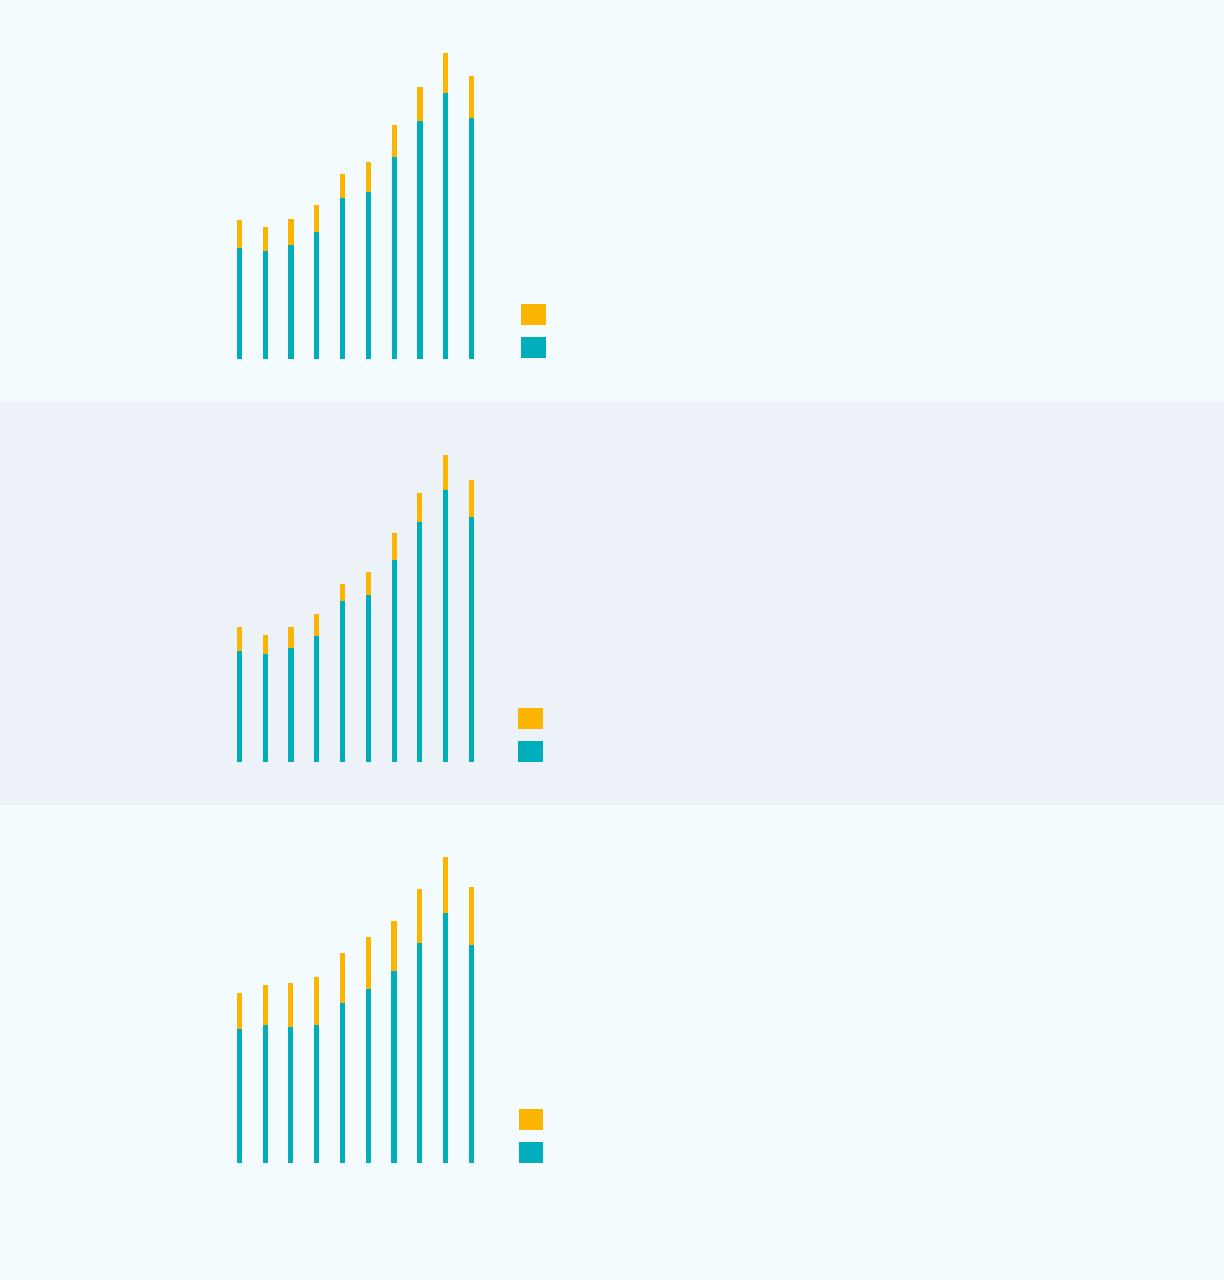
TOTAL ASSETS
(In billions)
Total assets were $121.3 billion
at the end of 2013.
TOTAL INVESTMENTS AND CASH
(In billions)
Aflac’s total investments and cash
declined 8.3% to $108.5 billion at the
end of 2013.
BENEFITS AND CLAIMS
(In billions)
Aflac paid or provided for $13.8 billion
in benefits for insureds in 2013.
04 05 06 07 08 09 10 11 12 13
100.2
131.1
59.3 56.4 59.8
65.8
79.3 84.1
116.2
$121.3
U.S.
Japan
04 05 06 07 08 09 10 11 12 13
88.2
118.2
52.0 49.0 52.0
57.1
68.6 73.2
103.5
$108.5
U.S.
Japan
04 05 06 07 08 09 10 11 12 13
12.1
15.3
8.5 8.9 9.0 9.3
10.5
11.3
13.7 $13.8
U.S.
Japan
AFLAC INCORPORATED 2013 YEAR IN REVIEW 9