Aflac 2013 Annual Report Download - page 29
Download and view the complete annual report
Please find page 29 of the 2013 Aflac annual report below. You can navigate through the pages in the report by either clicking on the pages listed below, or by using the keyword search tool below to find specific information within the annual report.-
 1
1 -
2
-
3
-
4
-
5
-
6
-
7
-
8
-
9
-
10
-
11
-
12
-
13
-
14
-
15
-
16
-
17
-
18
-
 19
19 -
 20
20 -
 21
21 -
 22
22 -
 23
23 -
 24
24 -
 25
25 -
 26
26 -
 27
27 -
 28
28 -
 29
29 -
 30
30 -
 31
31 -
 32
32 -
 33
33 -
 34
34 -
 35
35 -
 36
36 -
 37
37 -
 38
38 -
 39
39 -
40
 |
 |

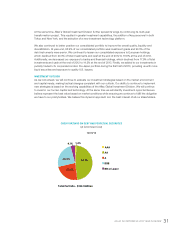
LOOKING TO THE FUTURE
The United States continues to provide a vast and accessible market for our
products and we remain focused on maintaining our position as the leading
provider of voluntary insurance at the worksite.
* We are confident in our brand
and the fundamental needs of our products.
We stand out from our competitors by upholding
our promise to be there for our policyholders
when they need us most by paying claims
fairly, promptly and directly to our claimants.
AFLAC U.S. – KEY OPERATIONAL METRICS
Policies and Annualized Total New Licensed Sales
Certificates Premiums Annualized Associates
in Force* in Force** Premiums** and Brokers
2013 12,310 $5,570 $1,424 76,305
2012 12,232 5,451 1,488 76,462
2011 11,732 5,18 8 1,476 74,802
2010 11,436 4,973 1,382 72,535
2009 11,6 88 4,956 1,453 75,315
2008 11,437 4,789 1,551 74,390
2007 11,116 4,510 1,558 71,258
2006 10,519 4,101 1,423 68,394
2005 9,884 3,711 1,259 63,008
2004 9,341 3,374 1,186 58,992
* In thousands
** In millions
*Source: Eastbridge Consulting Group, Inc. U.S. Worksite/Voluntary Sales Report. Carrier Results for
2012. Avon, CT: April 2013
AFLAC INCORPORATED 2013 YEAR IN REVIEW – AFLAC U.S. 27