Aflac 2013 Annual Report Download - page 10
Download and view the complete annual report
Please find page 10 of the 2013 Aflac annual report below. You can navigate through the pages in the report by either clicking on the pages listed below, or by using the keyword search tool below to find specific information within the annual report.-
 1
1 -
 2
2 -
 3
3 -
 4
4 -
 5
5 -
 6
6 -
 7
7 -
 8
8 -
 9
9 -
 10
10 -
 11
11 -
 12
12 -
 13
13 -
 14
14 -
 15
15 -
 16
16 -
 17
17 -
 18
18 -
 19
19 -
 20
20 -
 21
21 -
22
-
23
-
24
-
25
-
26
-
27
-
28
-
29
-
30
-
31
-
32
-
33
-
34
-
35
-
36
-
37
-
38
-
39
-
40
 |
 |
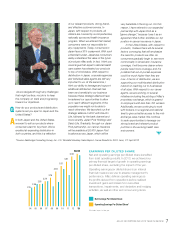
For 2013, the average yen/dollar exchange rate weakened 18.2% compared with 2012, which significantly suppressed Aflac Japan’s
growth rate in dollar terms. The yen/dollar exchange rate has not changed this dramatically since 1986. Because more than 77% of
Aflac’s premiums come from Japan, where the functional currency is the yen, the company believes it is important to understand the
impact of translating yen into dollars. Aflac Japan’s yen-denominated income statement is translated from yen into dollars using an
average exchange rate for the reporting period, and the balance sheet is translated using the exchange rate at the end of the period.
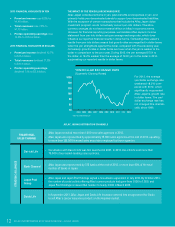
04 05 06 07 08 09 10 11 12 13
U.S.
Japan
20.7
13.3
14.4 14.6 15.4
16.6
18.3
22.2
$23.9
25.4
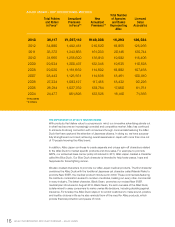
04 05 06 07 08 09 10 11 12 13
3.0
3.5
2.0 2.1 2.2 2.3
2.6
2.8
3.3 $3.3
U.S.
Japan
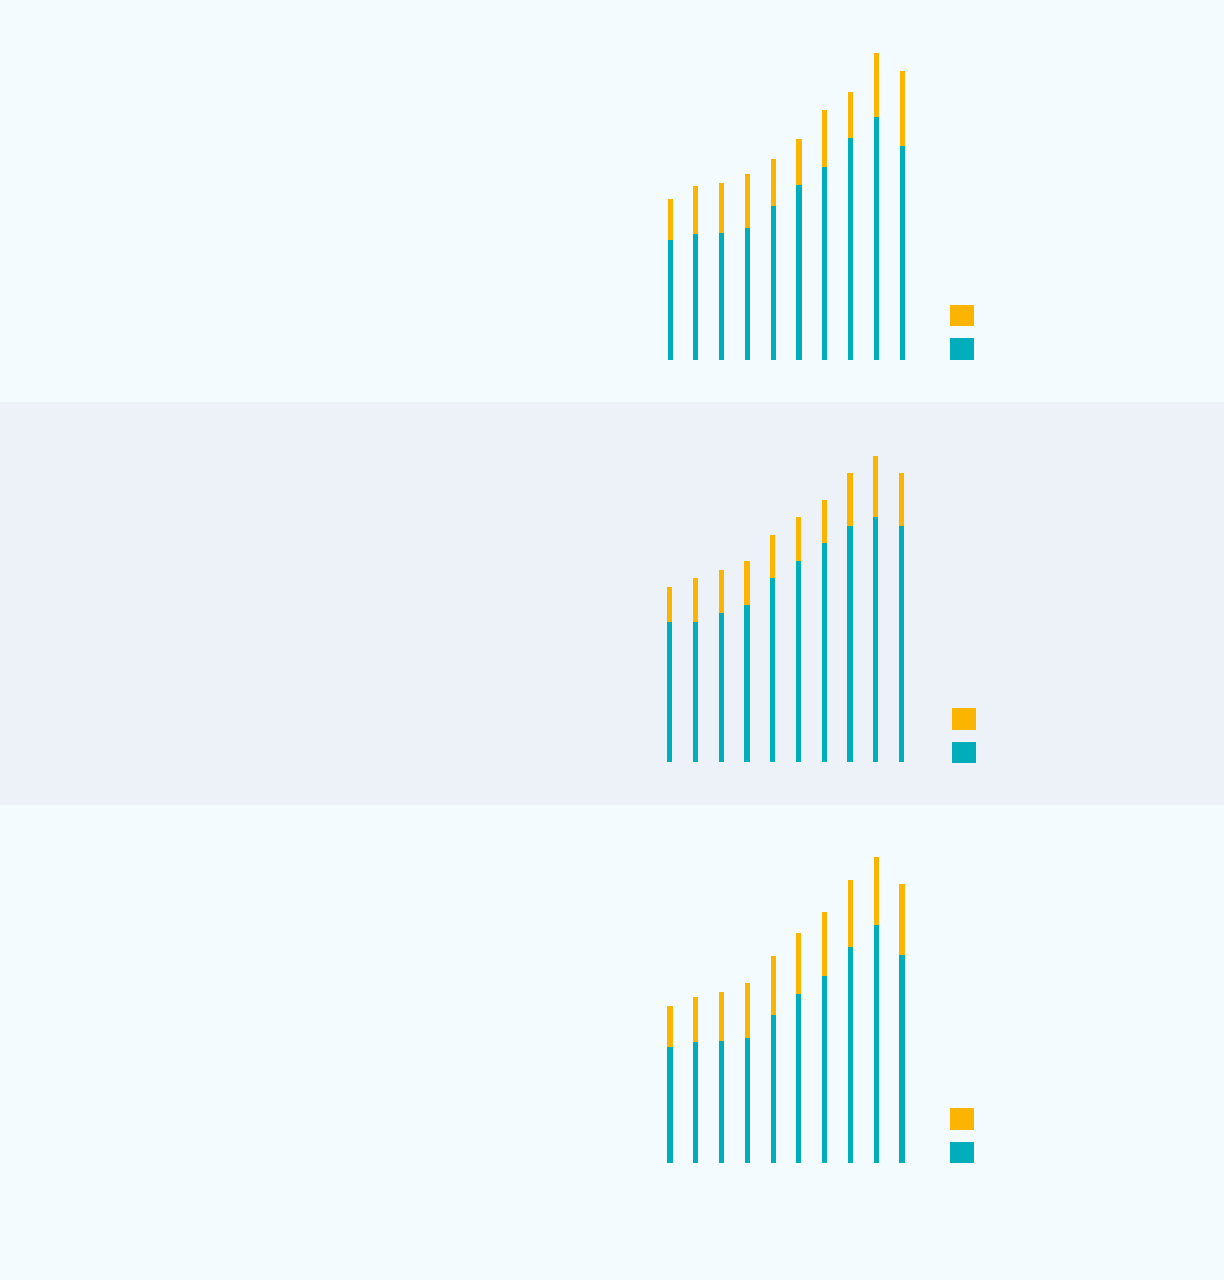
04 05 06 07 08 09 10 11 12 13
U.S.
Japan
18.1
22.1
11.3 12.0 12.3 13.0
14.9
16.6
20.4 $20.1
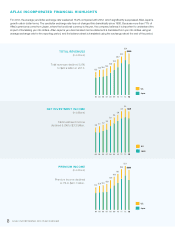
AFLAC INCORPORATED FINANCIAL HIGHLIGHTS
TOTAL REVENUES
(In billions)
Total revenues declined 5.6%
to $23.9 billion in 2013.
NET INVESTMENT INCOME
(In billions)
Net investment income
declined 5.2% to $3.3 billion.
PREMIUM INCOME
(In billions)
Premium income declined
9.1% to $20.1 billion.
8 AFLAC INCORPORATED 2013 YEAR IN REVIEW