Xcel Energy 2008 Annual Report Download - page 94
Download and view the complete annual report
Please find page 94 of the 2008 Xcel Energy annual report below. You can navigate through the pages in the report by either clicking on the pages listed below, or by using the keyword search tool below to find specific information within the annual report.-
 1
1 -
2
-
3
-
4
-
5
-
6
-
7
-
8
-
9
-
10
-
11
-
12
-
13
-
14
-
15
-
16
-
17
-
18
-
19
-
20
-
21
-
22
-
23
-
24
-
25
-
26
-
27
-
28
-
29
-
30
-
31
-
32
-
33
-
34
-
35
-
36
-
37
-
38
-
39
-
40
-
41
-
42
-
43
-
44
-
45
-
46
-
47
-
48
-
49
-
50
-
51
-
52
-
53
-
54
-
55
-
56
-
57
-
58
-
59
-
60
-
61
-
62
-
63
-
64
-
65
-
66
-
67
-
68
-
69
-
70
-
71
-
72
-
73
-
74
-
75
-
76
-
77
-
78
-
79
-
80
-
81
-
82
-
83
-
 84
84 -
 85
85 -
 86
86 -
 87
87 -
 88
88 -
 89
89 -
 90
90 -
 91
91 -
 92
92 -
 93
93 -
 94
94 -
 95
95 -
 96
96 -
 97
97 -
 98
98 -
 99
99 -
 100
100 -
 101
101 -
 102
102 -
 103
103 -
 104
104 -
105
-
106
-
107
-
108
-
109
-
110
-
111
-
112
-
113
-
114
-
115
-
116
-
117
-
118
-
119
-
120
-
121
-
122
-
123
-
124
-
125
-
126
-
127
-
128
-
129
-
130
-
131
-
132
-
133
-
134
-
135
-
136
-
137
-
138
-
139
-
140
-
141
-
142
-
143
-
144
-
145
-
146
-
147
-
148
-
149
-
150
-
151
-
152
-
153
-
154
-
155
-
156
-
157
-
158
-
159
-
160
-
161
-
162
-
163
-
164
-
165
-
166
-
167
-
168
-
169
-
170
-
171
-
172
 |
 |

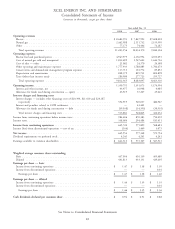
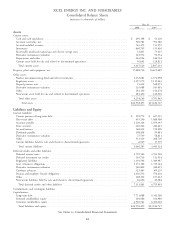
XCEL ENERGY INC. AND SUBSIDIARIES
Consolidated Balance Sheets
(amounts in thousands of dollars)
Dec. 31
2008 2007
Assets
Current assets:
Cash and cash equivalents ................................................. $ 249,198 $ 51,120
Accounts receivable, net ................................................... 900,781 951,580
Accrued unbilled revenues ................................................. 743,479 731,959
Inventories ........................................................... 666,709 531,610
Recoverable purchased natural gas and electric energy costs ............................. 32,843 73,415
Derivative instruments valuation ............................................. 101,972 94,554
Prepayments and other ................................................... 263,906 244,134
Current assets held for sale and related to discontinued operations ........................ 56,641 128,821
Total current assets .................................................... 3,015,529 2,807,193
Property, plant and equipment, net ............................................. 17,688,720 16,675,689
Other assets:
Nuclear decommissioning fund and other investments ................................ 1,232,081 1,372,098
Regulatory assets ....................................................... 2,357,279 1,115,443
Prepaid pension asset .................................................... 15,612 568,055
Derivative instruments valuation ............................................. 325,688 383,861
Other .............................................................. 142,130 142,078
Noncurrent assets held for sale and related to discontinued operations ...................... 181,456 120,310
Total other assets ..................................................... 4,254,246 3,701,845
Total assets ....................................................... $24,958,495 $23,184,727
Liabilities and Equity
Current liabilities:
Current portion of long-term debt ............................................ $ 558,772 $ 637,535
Short-term debt ....................................................... 455,250 1,088,560
Accounts payable ....................................................... 1,120,324 1,079,345
Taxes accrued ......................................................... 220,542 240,443
Accrued interest ....................................................... 168,632 150,490
Dividends payable ...................................................... 108,838 99,681
Derivative instruments valuation ............................................. 75,539 58,811
Other .............................................................. 331,419 268,720
Current liabilities held for sale and related to discontinued operations ...................... 6,929 17,539
Total current liabilities .................................................. 3,046,245 3,641,124
Deferred credits and other liabilities:
Deferred income taxes .................................................... 2,792,560 2,553,526
Deferred investment tax credits .............................................. 105,716 112,914
Regulatory liabilities ..................................................... 1,194,596 1,389,987
Asset retirement obligations ................................................ 1,135,182 1,315,144
Derivative instruments valuation ............................................. 340,802 384,419
Customer advances ...................................................... 323,445 305,239
Pension and employee benefit obligations ........................................ 1,030,532 576,426
Other .............................................................. 168,352 137,422
Noncurrent liabilities held for sale and related to discontinued operations .................... 20,656 20,384
Total deferred credits and other liabilities ...................................... 7,111,841 6,795,461
Commitments and contingent liabilities
Capitalization:
Long-term debt ........................................................ 7,731,688 6,342,160
Preferred stockholder’s equity ............................................... 104,980 104,980
Common stockholder’s equity ............................................... 6,963,741 6,301,002
Total liabilities and equity ................................................ $24,958,495 $23,184,727
See Notes to Consolidated Financial Statements
84