Xcel Energy 2008 Annual Report Download - page 86
Download and view the complete annual report
Please find page 86 of the 2008 Xcel Energy annual report below. You can navigate through the pages in the report by either clicking on the pages listed below, or by using the keyword search tool below to find specific information within the annual report.-
 1
1 -
2
-
3
-
4
-
5
-
6
-
7
-
8
-
9
-
10
-
11
-
12
-
13
-
14
-
15
-
16
-
17
-
18
-
19
-
20
-
21
-
22
-
23
-
24
-
25
-
26
-
27
-
28
-
29
-
30
-
31
-
32
-
33
-
34
-
35
-
36
-
37
-
38
-
39
-
40
-
41
-
42
-
43
-
44
-
45
-
46
-
47
-
48
-
49
-
50
-
51
-
52
-
53
-
54
-
55
-
56
-
57
-
58
-
59
-
60
-
61
-
62
-
63
-
64
-
65
-
66
-
67
-
68
-
69
-
70
-
71
-
72
-
73
-
74
-
75
-
 76
76 -
 77
77 -
 78
78 -
 79
79 -
 80
80 -
 81
81 -
 82
82 -
 83
83 -
 84
84 -
 85
85 -
 86
86 -
 87
87 -
 88
88 -
 89
89 -
 90
90 -
 91
91 -
 92
92 -
 93
93 -
 94
94 -
 95
95 -
 96
96 -
97
-
98
-
99
-
100
-
101
-
102
-
103
-
104
-
105
-
106
-
107
-
108
-
109
-
110
-
111
-
112
-
113
-
114
-
115
-
116
-
117
-
118
-
119
-
120
-
121
-
122
-
123
-
124
-
125
-
126
-
127
-
128
-
129
-
130
-
131
-
132
-
133
-
134
-
135
-
136
-
137
-
138
-
139
-
140
-
141
-
142
-
143
-
144
-
145
-
146
-
147
-
148
-
149
-
150
-
151
-
152
-
153
-
154
-
155
-
156
-
157
-
158
-
159
-
160
-
161
-
162
-
163
-
164
-
165
-
166
-
167
-
168
-
169
-
170
-
171
-
172
 |
 |

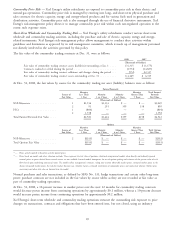
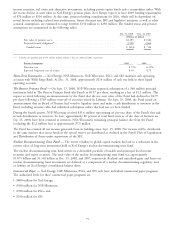
Credit Facilities — As of Feb. 13, 2009 Xcel Energy and its utility subsidiaries had the following committed credit
facilities available to meet its liquidity needs:
Company Facility(1) Drawn(2) Available Cash(3) Liquidity Maturity
(Millions of Dollars)
NSP-Minnesota ............. $ 482.2 $ 40.8 $ 441.4 $ 44.2 $ 485.6 December 2011
PSCo ................... 675.1 4.9 670.2 0.5 670.7 December 2011
SPS..................... 247.8 10.0 237.8 236.0 473.8 December 2011
Xcel Energy — Holding Company . 771.6 454.8 316.8 2.7 319.5 December 2011
NSP-Wisconsin(4) ............ — — — 71.2 71.2
Total .................. $2,176.7 $510.5 $1,666.2 $354.6 $2,020.8
(1) Reflects a reduction in the commitments resulting from the Lehman Brothers bankruptcy, which reduced the credit facilities by $73.3 million, collectively.
(2) Includes direct borrowings, outstanding commercial paper and issued and outstanding letters of credit.
(3) Reflects the payment of common dividends on Jan. 20, 2009.
(4) NSP-Wisconsin does not have a separate credit facility; however, it has a borrowing agreement with NSP-Minnesota.
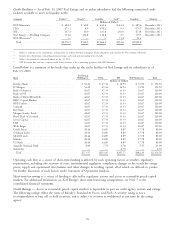
Listed below is a summary of the banks that make up the credit facilities of Xcel Energy and its subsidiaries as of
Feb. 13, 2009.
Xcel Energy
Bank Holding Co. PSCo SPS NSP-Minnesota Total
(Millions of Dollars)
Barclays Bank .......................... $54.22 $ 47.44 $ 16.94 $ 33.90 $ 152.50
JP Morgan ............................ 54.22 47.44 16.94 33.90 152.50
Bank of America ........................ 42.67 37.33 13.33 26.67 120.00
Bank of NY ........................... 42.67 37.33 13.33 26.67 120.00
Bank of Tokyo/Mitsubishi ................... 42.67 37.33 13.33 26.67 120.00
BMO Capital Markets ..................... 42.67 37.33 13.33 26.67 120.00
BNP Paribas ........................... 42.67 37.33 13.33 26.67 120.00
Citibank ............................. 42.67 37.33 13.33 26.67 120.00
Key Bank............................. 42.67 37.33 13.33 26.67 120.00
Morgan Stanley Bank ..................... 42.67 37.33 13.33 26.67 120.00
Royal Bank of Scotland .................... 42.67 37.33 13.33 26.67 120.00
Scotia Capital .......................... 42.67 37.33 13.33 26.67 120.00
UBS................................ 42.67 37.33 13.33 26.67 120.00
Wells Fargo ............................ 42.67 37.33 13.33 26.67 120.00
Credit Suisse ........................... 28.44 24.89 8.89 17.78 80.00
Goldman Sachs ......................... 28.44 24.89 8.89 17.78 80.00
Merrill Lynch .......................... 28.44 24.89 8.89 17.78 80.00
Mizuho .............................. 28.44 24.89 8.89 17.78 80.00
US Bank ............................. 28.44 24.89 8.89 17.78 80.00
Amarillo National Bank .................... 8.89 7.78 2.78 5.55 25.00
Sumitomo ............................ — — 6.70 — 6.70
Total .............................. $771.57 $675.07 $247.77 $482.29 $2,176.70
Operating cash flow as a source of short-term funding is affected by such operating factors as weather; regulatory
requirements, including rate recovery of costs; environmental regulation compliance; changes in the trends for energy
prices; supply and operational uncertainties and other changes in working capital, all of which are difficult to predict.
See further discussion of such factors under Statement of Operations Analysis.
Short-term borrowing as a source of funding is affected by regulatory actions and access to reasonably priced capital
markets. For additional information on Xcel Energy’s short-term borrowing arrangements, see Note 5 to the
consolidated financial statements.
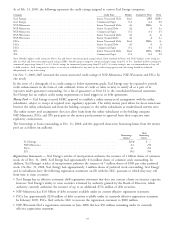
Credit Ratings — Access to reasonably priced capital markets is dependent in part on credit agency reviews and ratings.
The following ratings reflect the views of Moody’s, Standard & Poor’s, and Fitch. A security rating is not a
recommendation to buy, sell or hold securities, and is subject to revision or withdrawal at any time by the rating
agency.
76