Xcel Energy 2008 Annual Report Download - page 63
Download and view the complete annual report
Please find page 63 of the 2008 Xcel Energy annual report below. You can navigate through the pages in the report by either clicking on the pages listed below, or by using the keyword search tool below to find specific information within the annual report.-
 1
1 -
2
-
3
-
4
-
5
-
6
-
7
-
8
-
9
-
10
-
11
-
12
-
13
-
14
-
15
-
16
-
17
-
18
-
19
-
20
-
21
-
22
-
23
-
24
-
25
-
26
-
27
-
28
-
29
-
30
-
31
-
32
-
33
-
34
-
35
-
36
-
37
-
38
-
39
-
40
-
41
-
42
-
43
-
44
-
45
-
46
-
47
-
48
-
49
-
50
-
51
-
52
-
 53
53 -
 54
54 -
 55
55 -
 56
56 -
 57
57 -
 58
58 -
 59
59 -
 60
60 -
 61
61 -
 62
62 -
 63
63 -
 64
64 -
 65
65 -
 66
66 -
 67
67 -
 68
68 -
 69
69 -
 70
70 -
 71
71 -
 72
72 -
 73
73 -
74
-
75
-
76
-
77
-
78
-
79
-
80
-
81
-
82
-
83
-
84
-
85
-
86
-
87
-
88
-
89
-
90
-
91
-
92
-
93
-
94
-
95
-
96
-
97
-
98
-
99
-
100
-
101
-
102
-
103
-
104
-
105
-
106
-
107
-
108
-
109
-
110
-
111
-
112
-
113
-
114
-
115
-
116
-
117
-
118
-
119
-
120
-
121
-
122
-
123
-
124
-
125
-
126
-
127
-
128
-
129
-
130
-
131
-
132
-
133
-
134
-
135
-
136
-
137
-
138
-
139
-
140
-
141
-
142
-
143
-
144
-
145
-
146
-
147
-
148
-
149
-
150
-
151
-
152
-
153
-
154
-
155
-
156
-
157
-
158
-
159
-
160
-
161
-
162
-
163
-
164
-
165
-
166
-
167
-
168
-
169
-
170
-
171
-
172
 |
 |

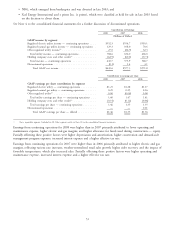
• NRG, which emerged from bankruptcy and was divested in late 2003; and
• Xcel Energy International and e prime Inc. (e prime), which were classified as held for sale in late 2003 based
on the decision to divest them.
See Note 4 to the consolidated financial statements for a further discussion of discontinued operations.
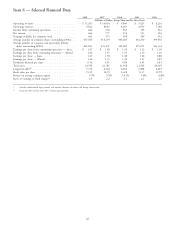
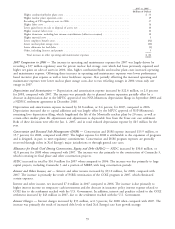
Contribution to Earnings
2008 2007 2006
(Millions of Dollars)
GAAP income by segment
Regulated electric utility income — continuing operations .... $552.3 $554.7 $503.1
Regulated natural gas utility income — continuing operations . 129.3 108.0 70.6
Other regulated utility income(a) .................... 27.0 (26.7) 32.3
Total utility income — continuing operations .......... 708.6 636.0 606.0
Holding company costs and other results(a) ............. (62.9) (60.1) (37.3)
Total income — continuing operations .............. 645.7 575.9 568.7
Discontinued operations ......................... (0.1) 1.4 3.1
Total GAAP net income ...................... $645.6 $577.3 $571.8
Contribution to earnings per share
2008 2007 2006
GAAP earnings per share contribution by segment
Regulated electric utility — continuing operations ......... $1.25 $1.28 $1.17
Regulated natural gas utility — continuing operations ...... 0.29 0.25 0.16
Other regulated utility(a) ......................... 0.06 (0.06) 0.08
Total utility earnings per share — continuing operations . . . 1.60 1.47 1.41
Holding company costs and other results(a) ............. (0.14) (0.12) (0.06)
Total earnings per share — continuing operations ........ 1.46 1.35 1.35
Discontinued operations ......................... — — 0.01
Total GAAP earnings per share — diluted ........... $1.46 $1.35 $1.36
(a) Not a reportable segment. Included in All Other segment results in Note 20 to the consolidated financial statements.
Earnings from continuing operations for 2008 were higher than in 2007 primarily attributed to lower operating and
maintenance expense, higher electric and gas margins, and higher allowance for funds used during construction — equity.
Partially offsetting these positive factors were higher depreciation and amortization, higher conservation and demand-side
management program expenses, increased interest expense and a higher effective tax rate.
Earnings from continuing operations for 2007 were higher than in 2006 primarily attributed to higher electric and gas
margins, reflecting various rate increases, weather-normalized retail sales growth, higher rider recovery, and the impact of
favorable temperatures, which also increased sales. Partially offsetting these positive factors were higher operating and
maintenance expense, increased interest expense and a higher effective tax rate.
53