Xcel Energy 2008 Annual Report Download - page 158
Download and view the complete annual report
Please find page 158 of the 2008 Xcel Energy annual report below. You can navigate through the pages in the report by either clicking on the pages listed below, or by using the keyword search tool below to find specific information within the annual report.-
 1
1 -
2
-
3
-
4
-
5
-
6
-
7
-
8
-
9
-
10
-
11
-
12
-
13
-
14
-
15
-
16
-
17
-
18
-
19
-
20
-
21
-
22
-
23
-
24
-
25
-
26
-
27
-
28
-
29
-
30
-
31
-
32
-
33
-
34
-
35
-
36
-
37
-
38
-
39
-
40
-
41
-
42
-
43
-
44
-
45
-
46
-
47
-
48
-
49
-
50
-
51
-
52
-
53
-
54
-
55
-
56
-
57
-
58
-
59
-
60
-
61
-
62
-
63
-
64
-
65
-
66
-
67
-
68
-
69
-
70
-
71
-
72
-
73
-
74
-
75
-
76
-
77
-
78
-
79
-
80
-
81
-
82
-
83
-
84
-
85
-
86
-
87
-
88
-
89
-
90
-
91
-
92
-
93
-
94
-
95
-
96
-
97
-
98
-
99
-
100
-
101
-
102
-
103
-
104
-
105
-
106
-
107
-
108
-
109
-
110
-
111
-
112
-
113
-
114
-
115
-
116
-
117
-
118
-
119
-
120
-
121
-
122
-
123
-
124
-
125
-
126
-
127
-
128
-
129
-
130
-
131
-
132
-
133
-
134
-
135
-
136
-
137
-
138
-
139
-
140
-
141
-
142
-
143
-
144
-
145
-
146
-
147
-
 148
148 -
 149
149 -
 150
150 -
 151
151 -
 152
152 -
 153
153 -
 154
154 -
 155
155 -
 156
156 -
 157
157 -
 158
158 -
 159
159 -
 160
160 -
 161
161 -
 162
162 -
 163
163 -
 164
164 -
 165
165 -
 166
166 -
 167
167 -
 168
168 -
169
-
170
-
171
-
172
 |
 |

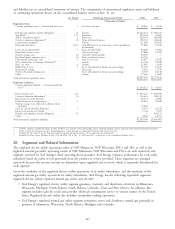
Revenues from operating segments not included above are below the necessary quantitative thresholds and are therefore
included in the all other category. Those primarily include steam revenue, appliance repair services, nonutility real estate
activities, revenues associated with processing solid waste into refuse-derived fuel and investments in rental housing
projects that qualify for low-income housing tax credits.
To report income from continuing operations for regulated electric and regulated natural gas utility segments, Xcel
Energy must assign or allocate all costs and certain other income. In general, costs are:
• Directly assigned wherever applicable;
• Allocated based on cost causation allocators wherever applicable; and
• Allocated based on a general allocator for all other costs not assigned by the above two methods.
The accounting policies of the segments are the same as those described in Note 1 to the consolidated financial
statements.
Regulated
Regulated Natural All Reconciling Consolidated
Electric Gas Other Eliminations Total
(Thousands of Dollars)
2008
Operating revenues from external customers ............. $8,682,993 $2,442,988 $ 77,175 $ — $11,203,156
Intersegment revenues .......................... 973 6,793 — (7,766) —
Total revenues ............................. $8,683,966 $2,449,781 $ 77,175 $ (7,766) $11,203,156
Depreciation and amortization ..................... $ 715,695 $ 99,306 $ 13,378 $ — $ 828,379
Interest charges and financing costs .................. 352,083 45,819 131,371 (15,392) 513,881
Income tax expense (benefit) ...................... 345,543 73,647 (80,504) — 338,686
Income (loss) from continuing operations ............... $ 552,300 $ 129,298 $ 27,346 $(63,224) $ 645,720
2007
Operating revenues from external customers ............. $7,847,992 $2,111,732 $ 74,446 $ — $10,034,170
Intersegment revenues .......................... 1,000 16,680 — (17,680) —
Total revenues ............................. $7,848,992 $2,128,412 $ 74,446 $(17,680) $10,034,170
Depreciation and amortization ..................... $ 695,571 $ 96,323 $ 13,837 $ — $ 805,731
Interest charges and financing costs .................. 318,937 43,985 180,757 (14,834) 528,845
Income tax expense (benefit) ...................... 343,184 50,150 (98,850) — 294,484
Income (loss) from continuing operations ............... $ 554,670 $ 108,054 $ (22,583) $(64,242) $ 575,899
2006
Operating revenues from external customers ............. $7,608,018 $2,155,999 $ 76,287 $ — $ 9,840,304
Intersegment revenues .......................... 820 12,296 — (13,116) —
Total revenues ............................. $7,608,838 $2,168,295 $ 76,287 $(13,116) $ 9,840,304
Depreciation and amortization ..................... $ 695,321 $ 91,965 $ 15,612 $ — $ 802,898
Interest charges and financing costs .................. 302,114 44,965 133,558 (24,605) 456,032
Income tax expense (benefit) ...................... 283,552 37,656 (139,797) — 181,411
Income (loss) from continuing operations ............... $ 503,119 $ 70,609 $ 51,570 $(56,617) $ 568,681
21. Summarized Quarterly Financial Data (Unaudited)
Due to the seasonality of Xcel Energy’s electric and natural gas sales, such interim results are not necessarily an
appropriate base from which to project annual results. Summarized quarterly unaudited financial data is as follows:
Quarter Ended
March 31, 2008 June 30, 2008 Sept. 30, 2008 Dec. 31, 2008
(Thousands of Dollars, except per share amounts)
Operating revenues ................................... $3,028,388 $2,615,515 $2,851,680 $2,707,573
Operating income ................................... 330,118 259,836 447,994 352,843
Income from continuing operations ......................... 153,994 105,473 222,695 163,558
Discontinued operations — income (loss) ...................... (877) 99 94 518
Net income ....................................... 153,117 105,572 222,789 164,076
Earnings available to common shareholders ..................... 152,057 104,512 221,729 163,015
Earnings per share total — basic ........................... $ 0.35 $ 0.24 $ 0.51 $ 0.36
Earnings per share total — diluted .......................... 0.35 0.24 0.51 0.36
148