Westjet 2007 Annual Report Download - page 19
Download and view the complete annual report
Please find page 19 of the 2007 Westjet annual report below. You can navigate through the pages in the report by either clicking on the pages listed below, or by using the keyword search tool below to find specific information within the annual report.-
 1
1 -
2
-
3
-
4
-
5
-
6
-
7
-
8
-
 9
9 -
 10
10 -
 11
11 -
 12
12 -
 13
13 -
 14
14 -
 15
15 -
 16
16 -
 17
17 -
 18
18 -
 19
19 -
 20
20 -
 21
21 -
 22
22 -
 23
23 -
 24
24 -
 25
25 -
 26
26 -
 27
27 -
 28
28 -
 29
29 -
30
-
31
-
32
-
33
-
34
-
35
-
36
-
37
-
38
-
39
-
40
-
41
-
42
-
43
-
44
-
45
-
46
-
47
-
48
-
49
-
50
-
51
-
52
-
53
-
54
-
55
-
56
-
57
-
58
-
59
-
60
-
61
-
62
-
63
-
64
 |
 |

WESTJET ANNUAL REPORT 2007 PAGE 17
Keeping costs low is a key component of our business
model and has played an important role in our ability
to generate industry-leading operating margins during
2007. Part of our competitive advantage is our ability
to operate with costs below that of our competitors.
We have achieved strong bottom-line performance by
continually striving for effi ciencies in our operations.
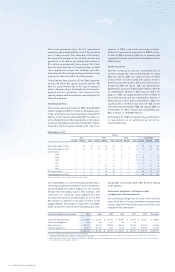
Fleet optimization was a continued focus in 2007, and
contributed to the overall productivity of our airline.
During the year, we increased our aircraft utilization
by 1.7 per cent to 12.1 operating block hours per day,
compared to 11.9 operating block hours per day in 2006.
Increasing the utilization of our aircraft allowed us to
gain cost effi ciencies.
Our longer average stage length, which increased 2.8
per cent in 2007 to 856 miles from 833 miles in 2006,
has played a role in creating cost effi ciencies. Average
stage length, defi ned as the average distance of a
fl ight between take-off and landing, has a signifi cant
impact on our unit costs. As average stage length
increases, cost effi ciencies are gained, and we achieve
a lower average cost per mile because our fi xed costs
of operations are allocated over an increasing number
of miles fl own. Likewise, longer-haul routes typically
achieve higher fuel economy, as we are able to absorb
the higher costs of fuel for take-offs and landings over
a longer trip length.
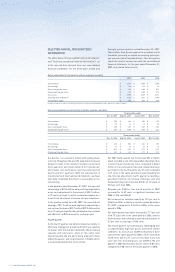
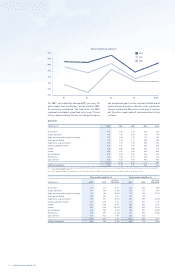
Aircraft fuel
Fuel is the most signifi cant cost to WestJet, representing
approximately 27 per cent of total operating expenses.
For 2007, our fuel cost per ASM increased from 3.40
cents to 3.46 cents, or 1.8 per cent when compared to
2006. Our fuel cost per ASM did not increase signifi cantly
for 2007 when compared to 2006 because of lower crude
oil prices in the early part of 2007 that more than offset
the rapid increase of crude oil in the latter half of the
year, as well as the strengthening Canadian dollar.
For the fourth quarter and full-year 2007, we saw the
strengthening Canadian dollar offset approximately 50
per cent of the higher crude oil prices. In the fourth
quarter of 2007, specifi cally December, crude oil prices
per barrel surged to break US $100. In the fourth
quarter, we saw crude oil prices increase approximately
50 per cent compared to the fourth quarter of 2006 and,
as a result, our 2007 fourth quarter fuel cost per ASM
increased dramatically to 3.73 cents or 16.2 per cent
when compared to the same period in 2006. For the
month of December, our fuel costs per ASM were 3.96
cents, an increase of 23 per cent from 2006.
In addition to the rising market price of crude oil, our
fuel cost per ASM increased due to higher fuel burn
associated with our record load factors. However, this
increase was tempered by our 2.8 per cent longer
average stage length in 2007, which contributed to
fuel effi ciency.
We mitigate high fuel costs through operating
effi ciencies inherent in our infrastructure. One of our
most signifi cant cost advantages is that we operate
one of the youngest fl eets of any large North American
commercial airline, comprised of fuel-effi cient Boeing
aircraft. Furthermore, we have implemented fuel
conservation programs throughout our operations to
minimize the impact of increasing energy costs. Our
700-series and 800-series aircraft are all equipped with
Blended Winglet Technology to help reduce drag and
provide more lift. Along with increasing the effi ciency of
our productive assets, our pilots and ground handlers
are proactive in seeking ways to contribute to daily fuel
cost savings.
To help lessen our exposure to fl uctuations in aircraft
fuel prices, we periodically use short-term and long-
term fi nancial and physical derivatives and account for
these derivatives as cash fl ow hedges. As at, and for the
year ended, December 31, 2007, we had no outstanding
fuel hedge contracts.
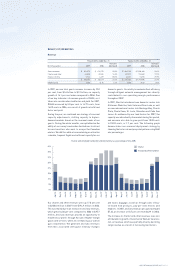
Airport operations
Airport operations expense consists primarily of airport
landing and terminal fees, as well as ground handling
and charter costs. These expenditures typically fl uctuate
depending on the destinations, aircraft weights,
inclement weather conditions and the number of guests.
In general, transborder fl ights are more expensive
than domestic fl ights due to increased charges from
domestic airports for higher terminal and pre-clearance
fees from inbound transborder fl ights.
For 2007, our cost per ASM for airport operations was
relatively fl at, increasing by 1.5 per cent to 1.99 cents
from 1.96 cents in 2006. This was due mainly to an
increase in airport rates and fees, as well as ground
handling fees across our destination network.
In 2007, costs per departure increased 1.4 per cent
over 2006’s costs. This increase was primarily due
to the increased number of transborder fl ights, the
utilization of larger aircraft resulting in higher fees
and the increased de-icing costs from poor weather
conditions in 2007.
Fee increases imposed by our airport and ground
handling partners impacted us on average by
approximately 2 per cent and 9 per cent, respectively.
These costs were further magnifi ed by our expanding
international charter and transborder operations, where
the number of departures grew by approximately 12
per cent in 2007 over 2006. Our cost per departure for
transborder and charter operations was approximately
40 per cent higher than that of our domestic fl ights.
Despite higher fees and costs per departure, our airport
CASM grew at a lesser rate primarily as a result of the
increase in our average stage length.
Airport operations make up one of our largest costs,
representing approximately 16 per cent of our total
operating expenditures. As we work to expand our
transborder and international network, these expenses
will continue to be signifi cant to our operations. In order
to properly manage these costs, which are generally
controlled by airport authorities, we continually look
for ways to improve productivity and reduce operational
costs while also increasing convenience for our
guests. We seek opportunities to automate our airport
operations by offering our guests convenient online
check-in services, equipping most of our airports with
self-serve kiosks, and by introducing the fl ow-through
check-in process at fi ve domestic airports in 2007. In
a fl ow-through check-in layout, our guests keep their
baggage with them after it is tagged and place it on the
baggage belt themselves. WestJet’s research shows
that the fl ow-through process model can reduce check-
in time by up to one minute per guest when compared
to a traditional linear check-in counter process. We
were also the fi rst airline in North America to introduce
electronic boarding passes at all Canadian airports. In
2008, we plan to introduce a self-tag baggage process
which is expected to further increase productivity and
reduce airport costs.