Westjet 2007 Annual Report Download - page 18
Download and view the complete annual report
Please find page 18 of the 2007 Westjet annual report below. You can navigate through the pages in the report by either clicking on the pages listed below, or by using the keyword search tool below to find specific information within the annual report.-
 1
1 -
2
-
3
-
4
-
5
-
6
-
7
-
 8
8 -
 9
9 -
 10
10 -
 11
11 -
 12
12 -
 13
13 -
 14
14 -
 15
15 -
 16
16 -
 17
17 -
 18
18 -
 19
19 -
 20
20 -
 21
21 -
 22
22 -
 23
23 -
 24
24 -
 25
25 -
 26
26 -
 27
27 -
 28
28 -
29
-
30
-
31
-
32
-
33
-
34
-
35
-
36
-
37
-
38
-
39
-
40
-
41
-
42
-
43
-
44
-
45
-
46
-
47
-
48
-
49
-
50
-
51
-
52
-
53
-
54
-
55
-
56
-
57
-
58
-
59
-
60
-
61
-
62
-
63
-
64
 |
 |

PAGE 16 WESTJET ANNUAL REPORT 2007
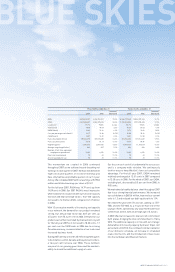
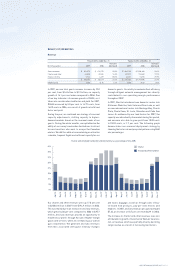
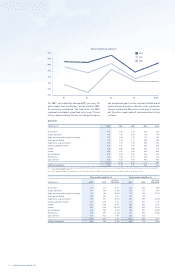
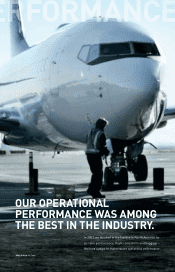
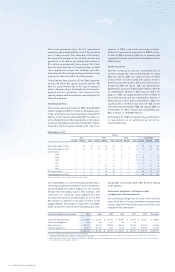
For 2007, our load factor averaged 80.7 per cent, 2.5
points higher than the 78.2 per cent recorded for 2006.
As previously mentioned, the load factor for 2007
represents our highest annual load factor in our 12-year
history, demonstrating that our on-time performance
and exceptional guest service continue to build brand
loyalty and repeat business. Results of our satisfaction
surveys indicate that 90 per cent of our guests say they
will fl y with us again and will recommend our airline
to others.
Expenses
CASM (cents) 2007 2006 2005 2004 2003
Aircraft fuel 3.46 3.40 3.32 2.69 2.27
Airport operations 1.99 1.96 2.04 1.94 1.78
Flight operations and navigational charges 1.78 1.83 1.72 1.66 1.53
Sales and marketing 1.30 1.30 1.16 0.95 0.84
Depreciation and amortization 0.87 0.89 1.00 0.88 0.92
General and administration 0.72 0.66 0.67 0.70 0.70
Infl ight 0.59 0.54 0.50 0.49 0.47
Interest 0.52 0.56 0.52 0.49 0.36
Aircraft leasing 0.52 0.57 0.62 0.46 0.64
Maintenance 0.51 0.54 0.67 0.85 1.06
Guest services 0.25 0.25 0.26 0.26 0.32
12.51 12.50 12.48 11.37 10.89
CASM, excluding fuel 9.05 9.10 9.16 8.68 8.62
Note 1: For comparative purposes, the impairment loss of $47,577,000 related to the retirement of 200-series aircraft included in depreciation and amortization expense has been excluded from
unit cost calculations for 2004.
Note 2: For comparative purposes, the impairment loss of $31,881,000 related to the aiRES reservation system has been excluded from unit cost calculations for 2007.
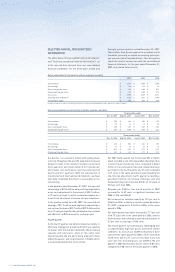
Three months ended Dec. 31 Twelve months ended Dec. 31
CASM (cents) 2007 2006
increase /
(decrease) 2007 2006
increase /
(decrease)
Aircraft fuel 3.73 3.21 16.2% 3.46 3.40 1.8%
Airport operations 1.81 1.87 (3.2%) 1.99 1.96 1.5%
Flight operations and navigational charges 1.73 1.88 (8.0%) 1.78 1.83 (2.7%)
Sales and marketing 1.38 1.30 6.2% 1.30 1.30 —
Depreciation and amortization 0.86 0.91 (5.5%) 0.87 0.89 (2.2%)
General and administration 0.70 0.68 2.9% 0.72 0.66 9.1%
Infl ight 0.62 0.56 10.7% 0.59 0.54 9.3%
Interest 0.51 0.58 (12.1%) 0.52 0.56 (7.1%)
Aircraft leasing 0.48 0.53 (9.4%) 0.52 0.57 (8.8%)
Maintenance 0.48 0.51 (5.9%) 0.51 0.54 (5.6%)
Guest services 0.27 0.26 3.8% 0.25 0.25 —
12.57 12.29 2.3% 12.51 12.50 0.1%
CASM, excluding fuel 8.84 9.08 (2.6%) 9.05 9.10 (0.5%)
Annual and quarterly load factors