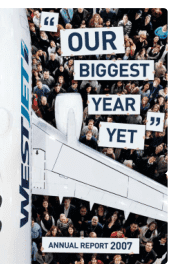
Westjet 2007 Annual Report Download - page 11
Download and view the complete annual report
Please find page 11 of the 2007 Westjet annual report below. You can navigate through the pages in the report by either clicking on the pages listed below, or by using the keyword search tool below to find specific information within the annual report.-
 1
1 -
 2
2 -
 3
3 -
 4
4 -
 5
5 -
 6
6 -
 7
7 -
 8
8 -
 9
9 -
 10
10 -
 11
11 -
 12
12 -
 13
13 -
 14
14 -
 15
15 -
 16
16 -
 17
17 -
 18
18 -
 19
19 -
 20
20 -
 21
21 -
 22
22 -
23
-
24
-
25
-
26
-
27
-
28
-
29
-
30
-
31
-
32
-
33
-
34
-
35
-
36
-
37
-
38
-
39
-
40
-
41
-
42
-
43
-
44
-
45
-
46
-
47
-
48
-
49
-
50
-
51
-
52
-
53
-
54
-
55
-
56
-
57
-
58
-
59
-
60
-
61
-
62
-
63
-
64
 |
 |

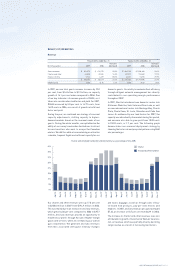
WESTJET ANNUAL REPORT 2007 PAGE 9
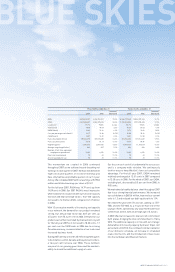
Three months ended Dec. 31 Twelve months ended Dec. 31
2007 2006
increase /
(decrease) 2007 2006
increase /
(decrease)
ASMs 3,818,613,107 3,314,759,901 15.2% 14,544,737,340 12,524,379,943 16.1%
RPMs 2,967,645,307 2,502,375,293 18.6% 11,739,063,003 9,791,878,403 19.9%
Load factor 77.7% 75.5% 2.2 pts 80.7% 78.2% 2.5 pts
Yield (cents) 18.65 18.07 3.2% 18.33 18.03 1.7%
RASM (cents) 14.49 13.64 6.2% 14.79 14.09 5.0%
Cost per passenger mile (cents) 16.17 16.28 (0.7%) 15.50 15.99 (3.1%)
CASM (cents) 12.57 12.29 2.3% 12.51 12.50 0.1%
Fuel consumption (litres) 189,434,295 165,605,465 14.4% 723,104,203 617,963,429 17.0%
Fuel costs/litre (cents) 75.15 64.19 17.1% 69.69 68.86 1.2%
Segment guests 3,280,342 2,889,435 13.5% 13,004,726 11,168,027 16.4%
Average stage length (miles) 869 827 5.1% 856 833 2.8%
Number of full-time equivalent
employees at period end 5,682 4,974 14.2% 5,682 4,974 14.2%
Fleet size at period end 70 63 11.1% 70 63 11.1%
Aircraft available for use 70 63 11.1% 70 63 11.1%
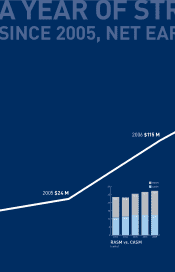
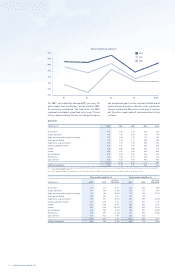
The momentum we created in 2006 continued
throughout 2007 as we achieved record-breaking net
earnings in each quarter of 2007. We have now delivered
eight consecutive quarters of record net earnings and
have only had two unprofi table quarters in our 12-year
history. We completed 2007 with net earnings of $192.8
million and diluted earnings per share of $1.47.
For the full-year 2007, RASM was 14.79 cents up from
14.09 cents in 2006. Our 2007 RASM is most impressive
when looked at in conjunction with our full-year capacity
increase and improved load factors. Year-end capacity
increased to 14.5 billion ASMs compared to 12.5 billion
in 2006.
With 12 consecutive months of increasing seat capacity
in our network, the demand for our product remained
strong. Our annual load factor was 80.7 per cent, up
2.5 points from 78.2 per cent in 2006. Demand for our
product was further illustrated by improvements in yield
for the full-year 2007 as it increased to 18.33 cents, 1.7
per cent over the 18.03 cents in 2006 due to a strong
Canadian economy, commercialization of our routes and
increased business travel.
During 2007, we fl ew a record 13.0 million segment guests
to destinations within Canada and beyond our borders,
a 16.4 per cent increase over 2006. These numbers
are proof of our growing guest base and the market’s
ability to absorb the additional supply of seats.
Our focus on cost control is fundamental to our success
and is a company-wide initiative. We continuously
look for ways to keep WestJet’s low-cost competitive
advantage. For the full-year 2007, CASM remained
relatively unchanged at 12.51 cents in 2007 compared
to 12.50 cents in 2006. For the whole of 2007, our CASM,
excluding fuel, decreased by 0.5 per cent from 2006, to
9.05 cents.
We maintained a healthy balance sheet throughout 2007
due to our strong fi nancial performance. We increased
our cash balance to $653.6 million, improved our current
ratio to 1.2 and reduced our debt-equity ratio to 1.94.
We ended the year with 70 aircraft, adding six 737-
700s and one 737-800. As a result, we have one of the
youngest fl eets operated by any large North American
commercial airline, with an average age of 3.2 years.
In 2007, WestJet increased its total aircraft commitment
by 31 planes, bringing the total committed fl eet to 116 by
2013. The additional capacity is in line with our strategic
deliverables of increasing capacity by at least 10 per cent
per annum until 2013, the continued commercialization
of our domestic schedule, an increase in scheduled
routes into the U.S. and the introduction of new routes
into the Caribbean and Mexican markets.