Westjet 2007 Annual Report Download - page 15
Download and view the complete annual report
Please find page 15 of the 2007 Westjet annual report below. You can navigate through the pages in the report by either clicking on the pages listed below, or by using the keyword search tool below to find specific information within the annual report.-
 1
1 -
2
-
3
-
4
-
 5
5 -
 6
6 -
 7
7 -
 8
8 -
 9
9 -
 10
10 -
 11
11 -
 12
12 -
 13
13 -
 14
14 -
 15
15 -
 16
16 -
 17
17 -
 18
18 -
 19
19 -
 20
20 -
 21
21 -
 22
22 -
 23
23 -
 24
24 -
 25
25 -
26
-
27
-
28
-
29
-
30
-
31
-
32
-
33
-
34
-
35
-
36
-
37
-
38
-
39
-
40
-
41
-
42
-
43
-
44
-
45
-
46
-
47
-
48
-
49
-
50
-
51
-
52
-
53
-
54
-
55
-
56
-
57
-
58
-
59
-
60
-
61
-
62
-
63
-
64
 |
 |

WESTJET ANNUAL REPORT 2007 PAGE 13
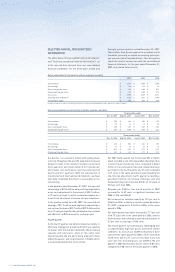
RESULTS OF OPERATIONS
Revenue
In 2007, we saw total guest revenues increase by 22.0
per cent, from $1.6 billion to $1.9 billion, on capacity
growth of 16.1 per cent when compared to 2006. One
of our key indicators of revenue growth is RASM, as it
takes into consideration load factor and yield. For 2007,
RASM increased by 5.0 per cent to 14.79 cents, from
14.09 cents in 2006, as a result of growth in both load
factor and yield.
During the year, we continued our strategy of seasonal
capacity adjustments, shifting capacity to higher-
demand markets based on the seasonal needs of our
guests. During the winter months, we capitalized on the
ability of our sunny transborder destinations to attract
leisure travellers who want to escape the Canadian
winters. We did this while also maintaining an attractive
schedule, frequent fl ights and suffi cient capacity for our
domestic guests. Our ability to maximize fl eet effi ciency
through diligent network management has directly
contributed to our operating margin performance
throughout 2007.
In 2007, WestJet introduced new domestic routes into
Kitchener-Waterloo, Saint John and Deer Lake, as well
as new international routes into Montego Bay, Puerto
Plata, Punta Cana, St. Lucia, Mazatlan and Cabo San
Lucas. As evidenced by our load factors for 2007, the
capacity was absorbed by the market during this period,
and we were also able to grow yield from 18.03 cents
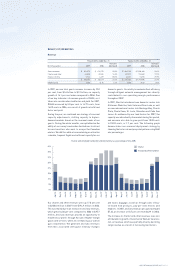
to 18.33 cents, or 1.7 per cent. The following graph
demonstrates our seasonal deployment strategy by
showing the historical and projected pattern using ASM
mix percentages.
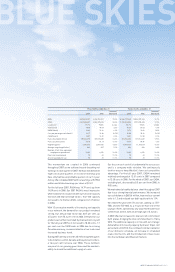
Three months ended Dec. 31 Twelve months ended Dec. 31
($ in thousands) 2007 2006
increase /
(decrease) 2007 2006
increase /
(decrease)
Guest revenues $ 502,379 $ 410,172 22.5% $ 1,899,159 $ 1,556,400 22.0%
Charter and other 43,055 37,666 14.3% 227,997 194,869 17.0%
Interest income 7,943 4,279 85.6% 24,301 13,815 75.9%
$ 553,377 $ 452,117 22.4% $ 2,151,457 $ 1,765,084 21.9%
RASM (cents) 14.49 13.64 6.2% 14.79 14.09 5.0%
Charter and scheduled transborder and international as a percentage of total ASMs
Our charter and other revenues were up 17.0 per cent
to $228.0 million in 2007 from $194.9 million in 2006.
This was mainly due to an increase in ancillary revenues,
which grew by 30 per cent compared to 2006 to $95.7
million. Ancillary revenues provide an opportunity to
maximize our profi ts through the sale of higher-margin
goods and services, while also enhancing our overall
guest experience. We generate ancillary revenues
from fees associated with guest itinerary changes
and excess baggage, as well as through sales of buy-
on-board food products, pay-per-view movies and
headsets. In 2007, ancillary revenues per guest averaged
$7.65, an increase of 10.7 per cent from $6.91 in 2006.
The increase in charter and other revenues was also
attributable to growth of incremental WestJet Vacations
non-air revenue, which was partially offset by declining
cargo revenue as a result of increasing load factors.