Visa 2007 Annual Report Download - page 6
Download and view the complete annual report
Please find page 6 of the 2007 Visa annual report below. You can navigate through the pages in the report by either clicking on the pages listed below, or by using the keyword search tool below to find specific information within the annual report.-
 1
1 -
 2
2 -
 3
3 -
 4
4 -
 5
5 -
 6
6 -
 7
7 -
 8
8 -
 9
9 -
 10
10 -
 11
11 -
 12
12 -
 13
13 -
 14
14 -
 15
15 -
 16
16 -
 17
17 -
18
-
19
-
20
-
21
-
22
-
23
-
24
-
25
-
26
-
27
-
28
-
29
-
30
-
31
-
32
-
33
-
34
-
35
-
36
-
37
-
38
-
39
-
40
-
41
-
42
-
43
-
44
-
45
-
46
-
47
-
48
-
49
-
50
-
51
-
52
-
53
-
54
-
55
-
56
-
57
-
58
-
59
-
60
-
61
-
62
-
63
-
64
-
65
-
66
-
67
-
68
-
69
-
70
-
71
-
72
-
73
-
74
-
75
-
76
-
77
-
78
-
79
-
80
-
81
-
82
-
83
-
84
-
85
-
86
-
87
-
88
-
89
-
90
-
91
-
92
-
93
-
94
-
95
-
96
-
97
-
98
-
99
-
100
-
101
-
102
-
103
-
104
-
105
-
106
-
107
-
108
-
109
-
110
-
111
-
112
-
113
-
114
-
115
-
116
-
117
-
118
-
119
-
120
-
121
-
122
-
123
-
124
-
125
-
126
-
127
-
128
-
129
-
130
-
131
-
132
-
133
-
134
-
135
-
136
-
137
-
138
-
139
-
140
-
141
-
142
-
143
-
144
-
145
-
146
-
147
-
148
-
149
-
150
-
151
-
152
-
153
-
154
-
155
-
156
-
157
-
158
-
159
-
160
-
161
-
162
-
163
-
164
-
165
-
166
-
167
-
168
-
169
-
170
-
171
-
172
-
173
-
174
-
175
-
176
-
177
-
178
-
179
-
180
-
181
-
182
-
183
-
184
-
185
-
186
-
187
-
188
-
189
-
190
-
191
-
192
-
193
-
194
-
195
-
196
-
197
-
198
-
199
-
200
-
201
-
202
-
203
-
204
-
205
-
206
-
207
-
208
-
209
-
210
-
211
-
212
-
213
-
214
-
215
-
216
-
217
-
218
-
219
-
220
-
221
-
222
-
223
-
224
-
225
-
226
-
227
-
228
-
229
-
230
-
231
-
232
-
233
-
234
-
235
-
236
 |
 |

Table of Contents
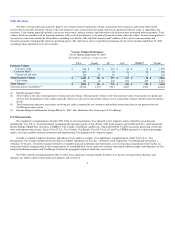
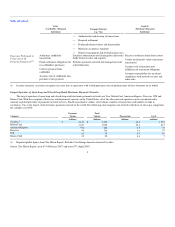
We derive revenues primarily from fees paid by our customers based on payments volume, transactions that we process and certain other related
services that we provide. Payments volume is the total monetary value of transactions for goods and services purchased with our cards, as reported by our
customers. Cash volume generally includes cash access transactions, balance transfers and convenience check transactions associated with our products. Total
volume, which we consider to be an important measure of the scale of our business, is the sum of payments volume and cash volume. An increasing portion of
our revenues come from outside the United States, including Asia Pacific (AP) and Latin America and Caribbean (LAC), where macroeconomic and
electronic payments trends provide attractive growth prospects. The table below shows our product performance for the twelve months ended June 30, 2007,
according to data reported to us by our customers:
Visa Inc. Product Performance
Twelve Months Ended June 30, 2007
All numbers in billions, except as noted
U.S.A. Canada AP LAC CEMEA(4) Visa Inc.
Payments Volume
Consumer credit $ 624 $ 125 $ 410 $ 80 $ 19 $ 1,258
Consumer debit(1) 637 — 23 41 29 730
Commercial and other 188 16 66 6 2 278
Total Payments Volume $ 1,449 $ 141 $ 499 $ 127 $ 50 $ 2,266
Cash volume 382 18 248 296 272 1,216
Total Volume(2) $ 1,831 $ 159 $ 747 $ 423 $ 322 $ 3,482
Total transactions (in millions)(3) 25,942 1,370 7,911 6,227 2,591 44,041
(1) Includes prepaid volume.
(2) Total volume is the sum of total payments volume and cash volume. Total payments volume is the total monetary value of transactions for goods and
services that are purchased. Cash volume generally consists of cash access transactions, balance access transactions, balance transfers and convenience
checks.
(3) Total transactions represents transactions involving our cards as reported by our customers and includes transactions that are not processed on our
VisaNet processing system.
(4) Includes Bulgaria and Romania through March 31, 2007, after which time they became part of Visa Europe.
Our Reorganization
We completed a reorganization in October 2007. Prior to our reorganization, Visa operated as five corporate entities related by ownership and
membership: Visa U.S.A., Visa International (comprising the operating regions of Asia Pacific (AP), Latin America and Caribbean (LAC), and Central and
Eastern Europe, Middle East and Africa (CEMEA)), Visa Canada, Visa Europe and Inovant, which operated the VisaNet transaction processing system and
other related processing systems. Each of Visa U.S.A., Visa Canada, Visa Europe, Visa AP, Visa LAC and Visa CEMEA operated as a separate geographic
region, serving its member financial institutions and administering Visa programs in its respective region.
In order to respond to industry dynamics and enhance Visa's ability to compete, Visa undertook a reorganization in which Visa U.S.A., Visa
International, Visa Canada and Inovant became direct or indirect subsidiaries of Visa Inc., a Delaware stock corporation. Visa Europe did not become a
subsidiary of Visa Inc., but rather remained owned by its member financial institutions and entered into a set of contractual arrangements with Visa Inc. in
connection with the reorganization. In the reorganization, we issued different classes and series of shares reflecting the different rights and obligations of Visa
financial institution members and Visa Europe based on the geographic region in which they are located.
We believe that the reorganization provides us with several significant strategic benefits. It allows us to increase our operational efficiency and
enhances our ability to deliver more innovative products and services to
5