Under Armour 2007 Annual Report Download - page 78
Download and view the complete annual report
Please find page 78 of the 2007 Under Armour annual report below. You can navigate through the pages in the report by either clicking on the pages listed below, or by using the keyword search tool below to find specific information within the annual report.-
 1
1 -
2
-
3
-
4
-
5
-
6
-
7
-
8
-
9
-
10
-
11
-
12
-
13
-
14
-
15
-
16
-
17
-
18
-
19
-
20
-
21
-
22
-
23
-
24
-
25
-
26
-
27
-
28
-
29
-
30
-
31
-
32
-
33
-
34
-
35
-
36
-
37
-
38
-
39
-
40
-
41
-
42
-
43
-
44
-
45
-
46
-
47
-
48
-
49
-
50
-
51
-
52
-
53
-
54
-
55
-
56
-
57
-
58
-
59
-
60
-
61
-
62
-
63
-
64
-
65
-
66
-
67
-
 68
68 -
 69
69 -
 70
70 -
 71
71 -
 72
72 -
 73
73 -
 74
74 -
 75
75 -
 76
76 -
 77
77 -
 78
78 -
 79
79 -
 80
80 -
 81
81 -
 82
82 -
 83
83 -
 84
84 -
 85
85 -
 86
86 -
 87
87 -
 88
88 -
89
-
90
-
91
-
92
 |
 |

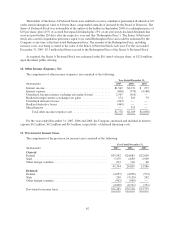
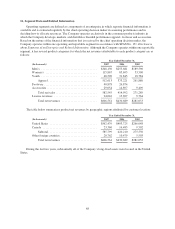
16. Segment Data and Related Information
Operating segments are defined as components of an enterprise in which separate financial information is
available and is evaluated regularly by the chief operating decision maker in assessing performance and in
deciding how to allocate resources. The Company operates exclusively in the consumer products industry in
which the Company develops, markets, and distributes branded performance apparel, footwear and accessories.
Based on the nature of the financial information that is received by the chief operating decision maker, the
Company operates within one operating and reportable segment in accordance with SFAS No. 131, Disclosures
about Segments of an Enterprise and Related Information. Although the Company operates within one reportable
segment, it has several product categories for which the net revenues attributable to each product category are as
follows:
Year Ended December 31,
(In thousands) 2007 2006 2005
Men’s ...................................... $348,150 $255,681 $189,596
Women’s ................................... 115,867 85,695 53,500
Youth ...................................... 48,596 31,845 18,784
Apparel ................................. 512,613 373,221 261,880
Footwear .................................... 40,878 26,874 —
Accessories .................................. 29,054 14,897 9,409
Total net sales ............................ 582,545 414,992 271,289
License revenues ............................. 24,016 15,697 9,764
Total net revenues ........................ $606,561 $430,689 $281,053
The table below summarizes product net revenues by geographic regions attributed by customer location:
Year Ended December 31,
(In thousands) 2007 2006 2005
United States ................................ $562,439 $403,725 $266,048
Canada ..................................... 23,360 16,485 9,502
Subtotal ................................. 585,799 420,210 275,550
Other foreign countries ......................... 20,762 10,479 5,503
Total net revenues ........................ $606,561 $430,689 $281,053
During the last two years, substantially all of the Company’s long-lived assets were located in the United
States.
68