Under Armour 2007 Annual Report Download - page 44
Download and view the complete annual report
Please find page 44 of the 2007 Under Armour annual report below. You can navigate through the pages in the report by either clicking on the pages listed below, or by using the keyword search tool below to find specific information within the annual report.-
 1
1 -
2
-
3
-
4
-
5
-
6
-
7
-
8
-
9
-
10
-
11
-
12
-
13
-
14
-
15
-
16
-
17
-
18
-
19
-
20
-
21
-
22
-
23
-
24
-
25
-
26
-
27
-
28
-
29
-
30
-
31
-
32
-
33
-
 34
34 -
 35
35 -
 36
36 -
 37
37 -
 38
38 -
 39
39 -
 40
40 -
 41
41 -
 42
42 -
 43
43 -
 44
44 -
 45
45 -
 46
46 -
 47
47 -
 48
48 -
 49
49 -
 50
50 -
 51
51 -
 52
52 -
 53
53 -
 54
54 -
55
-
56
-
57
-
58
-
59
-
60
-
61
-
62
-
63
-
64
-
65
-
66
-
67
-
68
-
69
-
70
-
71
-
72
-
73
-
74
-
75
-
76
-
77
-
78
-
79
-
80
-
81
-
82
-
83
-
84
-
85
-
86
-
87
-
88
-
89
-
90
-
91
-
92
 |
 |

Net income increased $19.3 million to $39.0 million in 2006 from $19.7 million in 2005, as a result of the
factors described above.
Seasonality
Historically, we have recognized a significant portion of our income from operations in the last two quarters
of the year, driven by increased sales volume of our products during the fall selling season, reflecting our
historical strength in fall sports, and the seasonality of our higher priced COLDGEAR®line. The majority of our
net revenues were generated during the last two quarters of 2007, 2006 and 2005. The level of our working
capital generally reflects the seasonality and growth in our business. We generally expect inventory, accounts
payable and certain accrued expenses to be higher in the second and third quarters in preparation for the fall
selling season. Nonetheless, the high percentage of income from operations and net revenues in the second half
of the year may have been in part due to our significant growth in net revenues.
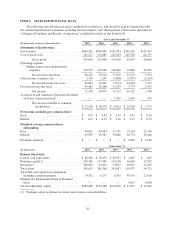
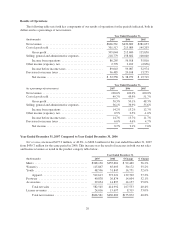
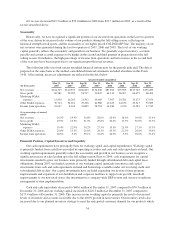
The following table sets forth certain unaudited financial information for the periods indicated. The data is
prepared on the same basis as the audited consolidated financial statements included elsewhere in this Form
10-K. All recurring, necessary adjustments are reflected in the data below.
Quarter Ended (unaudited)
(In thousands)
Mar 31,
2007
Jun 30,
2007
Sep 30,
2007
Dec 31,
2007
Mar 31,
2006
Jun 30,
2006
Sep 30,
2006
Dec 31,
2006
Net revenues ........... $124,329 $120,531 $186,863 $174,838 $87,696 $79,965 $127,745 $135,283
Gross profit ............ 60,581 59,099 94,517 90,847 44,312 38,207 64,675 68,406
Marketing SG&A
expenses ............ 13,830 16,283 21,502 19,605 7,507 10,561 13,175 17,076
Other SG&A expenses . . . 30,714 34,651 39,206 42,988 22,625 24,636 29,517 33,585
Income from operations . . 16,037 8,165 33,809 28,254 14,180 3,010 21,983 17,745
(As a percentage of annual
totals)
Net revenues ........... 20.5% 19.9% 30.8% 28.8% 20.4% 18.6% 29.6% 31.4%
Gross profit ............ 19.9% 19.3% 31.0% 29.8% 20.6% 17.7% 30.0% 31.7%
Marketing SG&A
expenses ............ 19.4% 22.9% 30.2% 27.5% 15.5% 21.9% 27.3% 35.3%
Other SG&A expenses . . . 20.8% 23.5% 26.6% 29.1% 20.5% 22.3% 26.8% 30.4%
Income from operations . . 18.6% 9.5% 39.1% 32.8% 24.9% 5.3% 38.6% 31.2%
Financial Position, Capital Resources and Liquidity
Our cash requirements have principally been for working capital and capital expenditures. Working capital
is primarily funded from cash flows provided by operating activities and cash and cash equivalents on hand. Our
working capital requirements generally reflect the seasonality and growth in our business as we recognize a
significant increase in sales leading up to the fall selling season. Prior to 2006, cash requirements for capital
investments needed to grow our business were primarily funded through subordinated debt and capital lease
obligations. During 2007, we funded a portion of our working capital (primarily inventory) and capital
investments from cash and cash equivalents on hand and borrowings available under our revolving credit and
subordinated debt facility. Our capital investments have included expanding our in-store fixture program,
improvements and expansion of our distribution and corporate facilities to support our growth, leasehold
improvements to our new retail stores, the investment in a company-wide ERP system and our new warehouse
management system implementation.
Cash and cash equivalents decreased to $40.6 million at December 31, 2007 compared to $70.7 million at
December 31, 2006 and our working capital increased to $226.5 million at December 31, 2007 compared to
$173.4 million at December 31, 2006. This increase in our working capital is primarily the result of increased
levels of inventory and accounts receivable due to the 40.8% growth in net revenues. Our inventory levels also
increased due to our planned inventory strategy to meet the anticipated consumer demand for our products which
34