Under Armour 2007 Annual Report Download - page 46
Download and view the complete annual report
Please find page 46 of the 2007 Under Armour annual report below. You can navigate through the pages in the report by either clicking on the pages listed below, or by using the keyword search tool below to find specific information within the annual report.-
 1
1 -
2
-
3
-
4
-
5
-
6
-
7
-
8
-
9
-
10
-
11
-
12
-
13
-
14
-
15
-
16
-
17
-
18
-
19
-
20
-
21
-
22
-
23
-
24
-
25
-
26
-
27
-
28
-
29
-
30
-
31
-
32
-
33
-
34
-
35
-
 36
36 -
 37
37 -
 38
38 -
 39
39 -
 40
40 -
 41
41 -
 42
42 -
 43
43 -
 44
44 -
 45
45 -
 46
46 -
 47
47 -
 48
48 -
 49
49 -
 50
50 -
 51
51 -
 52
52 -
 53
53 -
 54
54 -
 55
55 -
 56
56 -
57
-
58
-
59
-
60
-
61
-
62
-
63
-
64
-
65
-
66
-
67
-
68
-
69
-
70
-
71
-
72
-
73
-
74
-
75
-
76
-
77
-
78
-
79
-
80
-
81
-
82
-
83
-
84
-
85
-
86
-
87
-
88
-
89
-
90
-
91
-
92
 |
 |
stock-based compensation expense and increased deferred income tax assets. The increase in non-cash items was
partially offset by increased unrealized foreign currency exchanges rate gains on transactions.
Cash provided by operating activities decreased $5.1 million to $10.7 million in 2006 compared to $15.8
million in 2005. This decrease was due to higher cash outflows from operating assets and liabilities of $22.9
million and an increase in non-cash items of $1.4 million, offset by an increase in net income of $19.3 million
period-over-period. The increase in cash outflows from operating assets and liabilities period-over period was
primarily due to an increase in inventory levels of $20.8 million to support our 53.2% sales growth and a $3.5
million increase in income taxes receivable due to higher federal and state income tax payments made during
2006 compared to tax payments made during 2005.
Non-cash items decreased in 2006 primarily as a result of decreased cash outflows relating to deferred
income tax assets due to increased state tax credits earned in 2006. In addition, depreciation and amortization
increased period-over-period primarily due to the implementation of our new ERP system, acquisition of
additional assets and retail outlet store leasehold improvements.
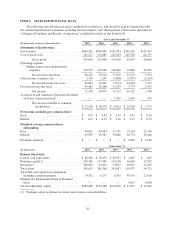
Investing Activities
Cash used in investing activities, which includes capital expenditures, increased $19.0 million to $34.1 million
in 2007 from $15.1 million in 2006. This increase in cash used in investing activities primarily represents the costs
to improve and to expand our distribution and corporate facilities, along with continued investment in our new
warehouse management system implementation, continued investments in our in-store fixture program, including
our concept shops, investments in our direct to consumer initiatives and other information technology initiatives.
Cash used in investing activities increased $4.3 million to $15.1 million in 2006 from $10.8 million in 2005.
This increase in cash used in investing activities primarily represents the additional costs to implement our new
ERP system, the continued investment in our in-store fixture program including our branded concept shops,
enhancements to the distribution facility and leasehold improvement to our new retail outlet stores. The new ERP
system became operational in April 2006.
From time to time, we invest a portion of our available cash and cash equivalents in short-term investments,
which consist of auction rate municipal bonds. These investments have stated maturities of 14 to 42 years and
have variable interest rates, which typically reset at regular auctions every 7 to 35 days. Despite the long-term
nature of their stated contractual maturities, we have the ability to liquidate these securities primarily through the
auction process. The income generated from these short-term investments is tax exempt and recorded as interest
income. At December 31, 2007, all investments had been sold and the proceeds were invested in highly liquid
investments with an original maturity of three months or less.
Total capital investments were $35.1 million, $18.2 million and $13.0 million in 2007, 2006 and 2005,
respectively. Total capital investments in 2007, 2006 and 2005 included non-cash transactions of $1.1 million,
$3.1 million and $2.1 million, respectively (see non-cash investing activities included on the consolidated
statements of cash flows). Because we finance some capital investments through capital leases and other types of
obligations, total capital investments exceed capital expenditures as described above. Capital investments for
2008 are anticipated to be in the range of $40.0 to $42.0 million, which will include investments in our branded
concept shops and in-store fixtures, upgrades and improvements to our information technology infrastructure,
including additional investments to our website, additional full-price retail stores, upgrades and improvements to
our existing distribution facilities, and additional general corporate improvements to support our growth.
Financing Activities
Cash provided by financing activities increased $5.5 million to $18.1 million in 2007 from $12.6 million in
2006. This increase was primarily due to higher proceeds received from long-term debt, partially offset by lower
excess tax benefits from stock-based compensation arrangements.
36