Under Armour 2007 Annual Report Download - page 42
Download and view the complete annual report
Please find page 42 of the 2007 Under Armour annual report below. You can navigate through the pages in the report by either clicking on the pages listed below, or by using the keyword search tool below to find specific information within the annual report.-
 1
1 -
2
-
3
-
4
-
5
-
6
-
7
-
8
-
9
-
10
-
11
-
12
-
13
-
14
-
15
-
16
-
17
-
18
-
19
-
20
-
21
-
22
-
23
-
24
-
25
-
26
-
27
-
28
-
29
-
30
-
31
-
 32
32 -
 33
33 -
 34
34 -
 35
35 -
 36
36 -
 37
37 -
 38
38 -
 39
39 -
 40
40 -
 41
41 -
 42
42 -
 43
43 -
 44
44 -
 45
45 -
 46
46 -
 47
47 -
 48
48 -
 49
49 -
 50
50 -
 51
51 -
 52
52 -
53
-
54
-
55
-
56
-
57
-
58
-
59
-
60
-
61
-
62
-
63
-
64
-
65
-
66
-
67
-
68
-
69
-
70
-
71
-
72
-
73
-
74
-
75
-
76
-
77
-
78
-
79
-
80
-
81
-
82
-
83
-
84
-
85
-
86
-
87
-
88
-
89
-
90
-
91
-
92
 |
 |

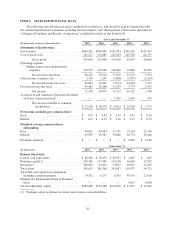
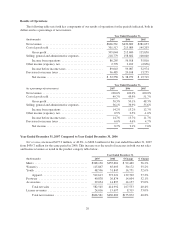
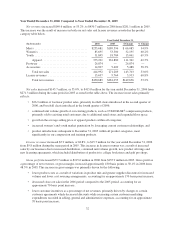
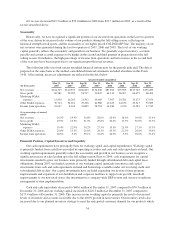
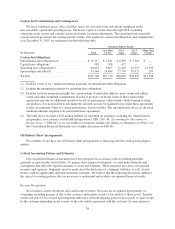
Year Ended December 31, 2006 Compared to Year Ended December 31, 2005
Net revenues increased $149.6 million, or 53.2%, to $430.7 million in 2006 from $281.1 million in 2005.
This increase was the result of increases in both our net sales and license revenues as noted in the product
category table below.
Year Ended December 31,
(In thousands) 2006 2005 $ Change % Change
Men’s .................................... $255,681 $189,596 $ 66,085 34.9%
Women’s ................................. 85,695 53,500 32,195 60.2%
Youth .................................... 31,845 18,784 13,061 69.5%
Apparel ............................... 373,221 261,880 111,341 42.5%
Footwear ................................. 26,874 — 26,874 —
Accessories ............................... 14,897 9,409 5,488 58.3%
Total net sales ......................... 414,992 271,289 143,703 53.0%
License revenues ........................... 15,697 9,764 5,933 60.8%
Total net revenues ...................... $430,689 $281,053 $149,636 53.2%
Net sales increased $143.7 million, or 53.0%, to $415.0 million for the year ended December 31, 2006 from
$271.3 million during the same period in 2005 as noted in the table above. The increase in net sales primarily
reflects:
• $26.9 million of footwear product sales, primarily football cleats introduced in the second quarter of
2006, and baseball cleats introduced in the fourth quarter of 2006;
• continued unit volume growth of our existing products, such as COLDGEAR®compression products,
primarily sold to existing retail customers due to additional retail stores and expanded floor space;
• growth in the average selling price of apparel products within all categories;
• increased women’s and youth market penetration by leveraging current customer relationships; and
• product introductions subsequent to December 31, 2005 within all product categories, most
significantly in our compression and training products.
License revenues increased $5.9 million, or 60.8%, to $15.7 million for the year ended December 31, 2006
from $9.8 million during the same period in 2005. This increase in license revenues was a result of increased
sales by our licensees due to increased distribution, continued unit volume growth, new product offerings and
new licensing agreements, which included distribution of products to college bookstores and golf pro shops.
Gross profit increased $79.7 million to $215.6 million in 2006 from $135.9 million in 2005. Gross profit as
a percentage of net revenues, or gross margin, increased approximately 180 basis points to 50.1% in 2006 from
48.3% in 2005. This increase in gross margin was primarily driven by the following:
• lower product costs as a result of variations in product mix and greater supplier discounts for increased
volume and lower cost sourcing arrangements, accounting for an approximate 170 basis point increase;
• decreased close-out sales in the 2006 period compared to the 2005 period, accounting for an
approximate 70 basis point increase;
• lower customer incentives as a percentage of net revenues, primarily driven by changes to certain
customer agreements which decreased discounts while increasing certain customer marketing
expenditures recorded in selling, general and administrative expenses, accounting for an approximate
70 basis point increase;
32