Under Armour 2007 Annual Report Download - page 40
Download and view the complete annual report
Please find page 40 of the 2007 Under Armour annual report below. You can navigate through the pages in the report by either clicking on the pages listed below, or by using the keyword search tool below to find specific information within the annual report.-
 1
1 -
2
-
3
-
4
-
5
-
6
-
7
-
8
-
9
-
10
-
11
-
12
-
13
-
14
-
15
-
16
-
17
-
18
-
19
-
20
-
21
-
22
-
23
-
24
-
25
-
26
-
27
-
28
-
29
-
 30
30 -
 31
31 -
 32
32 -
 33
33 -
 34
34 -
 35
35 -
 36
36 -
 37
37 -
 38
38 -
 39
39 -
 40
40 -
 41
41 -
 42
42 -
 43
43 -
 44
44 -
 45
45 -
 46
46 -
 47
47 -
 48
48 -
 49
49 -
 50
50 -
51
-
52
-
53
-
54
-
55
-
56
-
57
-
58
-
59
-
60
-
61
-
62
-
63
-
64
-
65
-
66
-
67
-
68
-
69
-
70
-
71
-
72
-
73
-
74
-
75
-
76
-
77
-
78
-
79
-
80
-
81
-
82
-
83
-
84
-
85
-
86
-
87
-
88
-
89
-
90
-
91
-
92
 |
 |
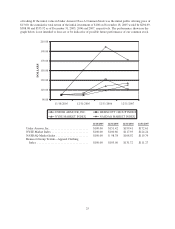
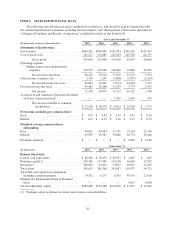
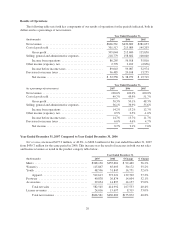
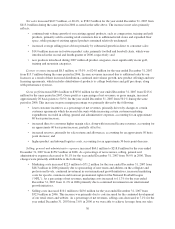
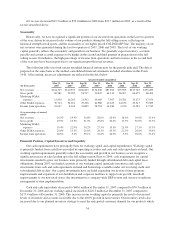
Net sales increased $167.5 million, or 40.4%, to $582.5 million for the year ended December 31, 2007 from
$415.0 million during the same period in 2006 as noted in the table above. The increase in net sales primarily
reflects:
• continued unit volume growth of our existing apparel products, such as compression, training and golf
products, primarily sold to existing retail customers due to additional retail stores and expanded floor
space, while pricing of existing apparel products remained relatively unchanged;
• increased average selling prices driven primarily by substantial growth in direct to consumer sales;
• $14.0 million increase in footwear product sales, primarily football and baseball cleats, which were
introduced in the second and fourth quarter of 2006, respectively; and
• new products introduced during 2007 within all product categories, most significantly in our golf,
training and mountain categories.
License revenues increased $8.3 million, or 53.0%, to $24.0 million for the year ended December 31, 2007
from $15.7 million during the same period in 2006. License revenues increased due to additional sales by our
licensees as a result of their increased distribution, continued unit volume growth, new product offerings and new
licensing agreements, which includes distribution of products to college bookstores and golf pro shops, along
with performance eyewear.
Gross profit increased $89.4 million to $305.0 million for the year ended December 31, 2007 from $215.6
million for the same period in 2007. Gross profit as a percentage of net revenues, or gross margin, increased
approximately 20 basis points to 50.3% for the year ended December 31, 2007 from 50.1% during the same
period in 2006. This increase in gross margin percentage was primarily driven by the following:
• lower customer incentives as a percentage of net revenues, primarily driven by changes to certain
customer agreements which decreased discounts while increasing certain customer marketing
expenditures recorded in selling, general and administrative expenses, accounting for an approximate
80 basis point increase;
• increased direct to consumer higher margin sales, along with increased license revenues, accounting for
an approximate 60 basis point increase, partially offset by;
• increased reserves, primarily for sales returns and allowances, accounting for an approximate 50 basis
point decrease; and
• higher product and inbound logistics costs, accounting for an approximate 50 basis point decrease.
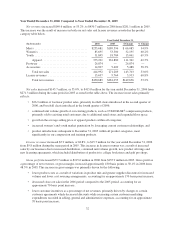
Selling, general and administrative expenses increased $60.1 million to $218.8 million for the year ended
December 31, 2007 from $158.7 million in 2006. As a percentage of net revenues, selling, general and
administrative expenses decreased to 36.1% for the year ended December 31, 2007 from 36.9% in 2006. These
changes were primarily attributable to the following:
• Marketing costs increased $22.9 million to $71.2 million for the year ended December 31, 2007 from
$48.3 million in 2006 primarily due to sponsorship of new teams and athletes on the collegiate and
professional levels, continued investment in our international growth initiatives, increased marketing
costs for specific customers and footwear promotional rights for the National Football League
(“NFL”). As a percentage of net revenues, marketing costs increased to 11.7% for the year ended
December 31, 2007 from 11.2% in 2006 primarily due to continued investment in our international
growth initiatives.
• Selling costs increased $10.1 million to $43.0 million for the year ended December 31, 2007 from
$32.9 million in 2006. This increase was primarily due to costs incurred for the continued development
of our retail stores and website. As a percentage of net revenues, selling costs decreased to 7.1% for the
year ended December 31, 2007 from 7.6% in 2006 as we were able to achieve leverage from our sales
30