TD Bank 2009 Annual Report Download - page 4
Download and view the complete annual report
Please find page 4 of the 2009 TD Bank annual report below. You can navigate through the pages in the report by either clicking on the pages listed below, or by using the keyword search tool below to find specific information within the annual report.-
 1
1 -
 2
2 -
 3
3 -
 4
4 -
 5
5 -
 6
6 -
 7
7 -
 8
8 -
 9
9 -
 10
10 -
 11
11 -
 12
12 -
 13
13 -
 14
14 -
 15
15 -
16
-
17
-
18
-
19
-
20
-
21
-
22
-
23
-
24
-
25
-
26
-
27
-
28
-
29
-
30
-
31
-
32
-
33
-
34
-
35
-
36
-
37
-
38
-
39
-
40
-
41
-
42
-
43
-
44
-
45
-
46
-
47
-
48
-
49
-
50
-
51
-
52
-
53
-
54
-
55
-
56
-
57
-
58
-
59
-
60
-
61
-
62
-
63
-
64
-
65
-
66
-
67
-
68
-
69
-
70
-
71
-
72
-
73
-
74
-
75
-
76
-
77
-
78
-
79
-
80
-
81
-
82
-
83
-
84
-
85
-
86
-
87
-
88
-
89
-
90
-
91
-
92
-
93
-
94
-
95
-
96
-
97
-
98
-
99
-
100
-
101
-
102
-
103
-
104
-
105
-
106
-
107
-
108
-
109
-
110
-
111
-
112
-
113
-
114
-
115
-
116
-
117
-
118
-
119
-
120
-
121
-
122
-
123
-
124
-
125
-
126
-
127
-
128
-
129
-
130
-
131
-
132
-
133
-
134
-
135
-
136
-
137
-
138
-
139
-
140
-
141
-
142
-
143
-
144
-
145
-
146
-
147
-
148
-
149
-
150
-
151
-
152
-
153
-
154
-
155
-
156
-
157
-
158
 |
 |

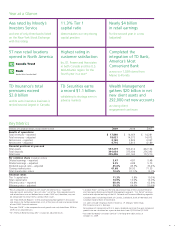
Year at a Glance
11.3% Tier 1
capital ratio
demonstrates our very strong
capital position
Nearly $4 billion
in retail earnings
for the second year in a row
(adjusted)
Highest rating in
customer satisfaction
by J.D. Power and Associates
in both Canada and the U.S.
Mid-Atlantic region for the
fourth year in a row*
57 new retail locations
opened in North America Completed the
integration of TD Bank,
America’s Most
Convenient Bank
across our 1,028 stores from
Maine to Florida
Aaa rated by Moody’s
Investors Service
and one of only three banks listed
on the New York Stock Exchange
with this rating
TD Securities earns
a record $1.1 billion
validating its strategy even in
adverse markets
TD Insurance’s total
premiums exceed
$2.8 billion
and its auto insurance business is
ranked second largest in Canada
Wealth Management
gathers $20 billion in net
new client assets and
292,000 net new accounts
as strong client
engagement continues
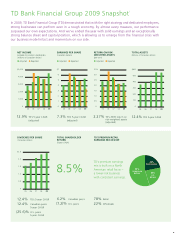
Key Metrics
(millions of Canadian dollars, except where noted) 2009 2008 2007
Results of operations
Total revenues – reported $ 17,860 $ 14,669 $ 14,281
Total revenues – adjusted 18,621 14,372 14,072
Net income – reported 3,120 3,833 3,997
Net income – adjusted 4,716 3,813 4,189
Financial positions at year-end
Total assets 557,219 563,214 422,124
Total deposits 391,034 375,694 276,393
Total loans 255,496 221,160 177,210
Per common share (Canadian dollars)
Diluted earnings – reported 3.47 4.87 5.48
Diluted earnings – adjusted 5.35 4.88 5.75
Dividend payout ratio – adjusted 45.6% 49.3% 36.4%
Closing market price 61.68 56.92 71.35
Total shareholder return 13.6% (17.1)% 13.0%
Financial ratios
Tier 1 capital ratio 11.3% 9.8% 10.3%
Total capital ratio 14.9% 12.0% 13.0%
Efficiency ratio – reported 68.4% 64.8% 62.8%
Efficiency ratio – adjusted 59.2% 64.6% 59.6%
1Results prepared in accordance with GAAP are referred to as “reported.”
Adjusted results (excluding “items of note,” net of tax, from reported results)
and related terms are not defined terms under GAAP and, therefore, may not
be comparable to similar terms used by other issuers.
See “How the Bank Reports” in the accompanying Management’s Discussion
and Analysis for further explanation, a list of the items of note and reconciliation
of non-GAAP financial measures.
“Five-year CAGR” is the compound annual growth rate calculated from 2004 to
2009, on an adjusted basis.
“TD's Premium Retail Earnings Mix” is based on adjusted results.
“C
anadian Retail” earnings are the total adjusted earnings of the Canadian Personal
and Commercial Banking and Wealth Management segments. “U.S. Retail” earnings
are the total adjusted earnings of the U.S. Personal and Commercial Banking segments.
Canadian peers include Royal Bank of Canada, Scotiabank, Bank of Montreal and
Canadian Imperial Bank of Commerce.
U.S. peers include Citigroup, Bank of America, J.P. Morgan, Wells Fargo,
PNC Financial and U.S. Bancorp.
For purposes of comparison with U.S. peers, dividends per share five-year compound
growth rate are calculated on a year-to-date basis from Q3 2004 to Q3 2009.
“Aaa rated by Moody's Investors Service” is for long-term debt and as at
October 31, 2009.