TD Bank 2009 Annual Report Download - page 3
Download and view the complete annual report
Please find page 3 of the 2009 TD Bank annual report below. You can navigate through the pages in the report by either clicking on the pages listed below, or by using the keyword search tool below to find specific information within the annual report.-
 1
1 -
 2
2 -
 3
3 -
 4
4 -
 5
5 -
 6
6 -
 7
7 -
 8
8 -
 9
9 -
 10
10 -
 11
11 -
 12
12 -
 13
13 -
 14
14 -
15
-
16
-
17
-
18
-
19
-
20
-
21
-
22
-
23
-
24
-
25
-
26
-
27
-
28
-
29
-
30
-
31
-
32
-
33
-
34
-
35
-
36
-
37
-
38
-
39
-
40
-
41
-
42
-
43
-
44
-
45
-
46
-
47
-
48
-
49
-
50
-
51
-
52
-
53
-
54
-
55
-
56
-
57
-
58
-
59
-
60
-
61
-
62
-
63
-
64
-
65
-
66
-
67
-
68
-
69
-
70
-
71
-
72
-
73
-
74
-
75
-
76
-
77
-
78
-
79
-
80
-
81
-
82
-
83
-
84
-
85
-
86
-
87
-
88
-
89
-
90
-
91
-
92
-
93
-
94
-
95
-
96
-
97
-
98
-
99
-
100
-
101
-
102
-
103
-
104
-
105
-
106
-
107
-
108
-
109
-
110
-
111
-
112
-
113
-
114
-
115
-
116
-
117
-
118
-
119
-
120
-
121
-
122
-
123
-
124
-
125
-
126
-
127
-
128
-
129
-
130
-
131
-
132
-
133
-
134
-
135
-
136
-
137
-
138
-
139
-
140
-
141
-
142
-
143
-
144
-
145
-
146
-
147
-
148
-
149
-
150
-
151
-
152
-
153
-
154
-
155
-
156
-
157
-
158
 |
 |

12.4% TD’s 5-year CAGR
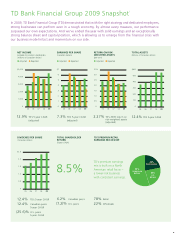
TD Bank Financial Group 2009 Snapshot1
In 2009, TD Bank Financial Group (TD) demonstrated that with the right strategy and dedicated employees,
strong businesses can perform even in a tough economy. By almost every measure, our performance
surpassed our own expectations. And we’ve ended the year with solid earnings and an exceptionally
strong balance sheet and capital position, which is allowing us to emerge from the financial crisis with
our business model intact and momentum on our side.
12.9% TD’s 5-year CAGR
(adjusted)
7.3% TD’s 5-year CAGR
(adjusted)
12.4% TD’s 5-year CAGR
12.4% Canadian peers
5-year CAGR
(25.6)% U.S. peers
5-year CAGR
2.27% TD’s 2009 return on
risk-weighted assets
(adjusted)
6.2% Canadian peers
(7.2)% U.S. peers
78% Retail
22% Wholesale
8.5% TD’s premium earnings
mix is built on a North
American retail focus –
a lower-risk business
with consistent earnings.
55%
CANADIAN
RETAIL
23%
U.S.
RETAIL
22%
WHOLESALE
05 06 07 0809
0
$5,000
4,000
3,000
2,000
1,000
NET INCOME
available to common shareholders
(millions of Canadian dollars)
Adjusted Reported
05 06 07 0809
5
6
$7
4
3
2
1
0
EARNINGS PER SHARE
(Canadian dollars)
Adjusted Reported
05 06 07 0809
3.5%
1.0
0.5
3.0
2.5
2.0
1.5
0
RETURN ON RISK-
WEIGHTED ASSETS
(per cent)
Adjusted Reported
05 06 07 0809
100
300
400
$600
500
200
0
TOTAL ASSETS
(billions of Canadian dollars)
05 06 07 0809
0.5
1.5
2.0
$2.5
1.0
0
DIVIDENDS PER SHARE
(Canadian dollars)
TOTAL SHAREHOLDER
RETURN
(5-year CAGR)
TD’S PREMIUM RETAIL
EARNINGS MIX IN 2009