Stein Mart 2011 Annual Report Download - page 20
Download and view the complete annual report
Please find page 20 of the 2011 Stein Mart annual report below. You can navigate through the pages in the report by either clicking on the pages listed below, or by using the keyword search tool below to find specific information within the annual report.-
 1
1 -
2
-
3
-
4
-
5
-
6
-
7
-
8
-
9
-
 10
10 -
 11
11 -
 12
12 -
 13
13 -
 14
14 -
 15
15 -
 16
16 -
 17
17 -
 18
18 -
 19
19 -
 20
20 -
 21
21 -
 22
22 -
 23
23 -
 24
24 -
 25
25 -
 26
26 -
 27
27 -
 28
28 -
 29
29 -
 30
30 -
31
-
32
-
33
-
34
-
35
-
36
-
37
-
38
-
39
-
40
-
41
-
42
-
43
-
44
-
45
-
46
-
47
-
48
-
49
-
50
-
51
-
52
-
53
 |
 |

Table of Contents
Liquidity and Capital Resources
Our primary source of liquidity is the sale of merchandise inventories. Capital requirements and working capital needs are funded through a
combination of internally generated funds, available cash, credit terms from vendors and our revolving credit facility. Working capital is
needed to support store inventories and capital investments for new store openings and to maintain existing stores. Historically, our working
capital needs are lowest in the first quarter and highest at the end of the third quarter and beginning of the fourth quarter as we build inventories
for the holiday selling season.
As of January 28, 2012, we had $94.1 million in cash and cash equivalents and $91.4 million of borrowing availability under our Credit
Agreement. We believe that we will continue to generate positive cash flows from operations on a full year basis. Internally generated cash,
along with our available cash and borrowing capacity under the revolving credit agreement, will provide the means needed to fund our
operations for the foreseeable future.
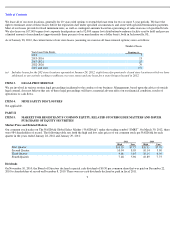
The following table presents cash flows data for fiscal 2011, fiscal 2010 and fiscal 2009 (in thousands):
Cash provided by operating activities
Cash provided by operating activities increased $9.9 million to $59.6 million in 2011 compared to 2010 due to $21.0 million less cash used for
inventories and accounts payable and $1.7 million more cash provided by other operating activities, offset by $12.8 million less cash provided
by net income plus non-cash charges. Although inventories were lower at the end of this year compared to the end of last year, accounts
payable was higher due to our lengthened vendor payment terms implemented during 2011 to be more consistent with industry practices.
Cash provided by operating activities decreased $48.7 million to $49.6 million in 2010 compared to 2009 primarily due to $12.6 million more
cash used for inventories and accounts payable and $32.7 million less cash from income tax receivable/payable (including $24.6 million of net
operating loss carry back refunds in 2009). Inventories at the end of 2010 were $14.2 million higher than at the end of 2009 primarily due to
higher inventory balances in our warehouse and distribution centers. The timing of receipts and vendor payments increased accounts payable at
the end of 2010 compared to the end of 2009.
Cash used in investing activities
Net cash used in investing activities was solely for capital expenditures. Capital expenditures in 2011 and 2010 include approximately $20
million and $19 million, respectively, for systems improvements, with the largest portion for our new merchandise information system. The
remaining capital amounts are for opening and remodeling stores, including upgrades to fitting rooms, lighting, flooring and fixtures in
approximately 40 stores in 2011. We also replaced our point-of-sale system hardware during 2011, primarily with assets acquired through
capital leases.
We expect to invest approximately $36 million in capital expenditures in 2012, with $18 million for continuing information systems upgrades,
and the remainder for new and relocated stores, store remodels and new fixtures. The cost of opening a new store ranges from $550,000 to
$600,000 for fixtures, equipment, leasehold improvements and pre-opening costs (primarily advertising, stocking and training). Pre-opening
costs are expensed at the time of opening. Initial inventory investment for a new store is approximately $800,000.
Cash used in financing activities
During 2011 we repurchased 1.7 million shares of our common stock at a cost of $12.1 million compared to 0.9 million shares at a cost of $7.1
million in 2010. Financing activities for 2010 also include $22.2 million for payment of a special dividend of $0.50 per share. There were no
financing activities on our revolving credit agreement in 2011 or 2010, while 2009 included the repayment of borrowings.
In October 2011, we entered into an amended and restated revolving credit agreement (the “Credit Agreement”) with Wells Fargo Bank, N.A.
The Credit Agreement provides for a $100 million senior secured revolving credit facility which can be increased to $150 million. The Credit
Agreement matures on February 28, 2017. The amount available for borrowing was $91.4 million at January 28, 2012 and is based on 90% of
eligible credit card receivables and inventories less reserves, as defined in the Credit Agreement. The amount available for borrowing
represents the capped borrowing base of $100 million reduced by outstanding letters of credit of $8.6 million. We did not use our revolving
credit facility in 2011 or 2010, other than for outstanding letters of credit. We had no direct borrowings at January 28, 2012 and are in
compliance with the terms of the Agreement.
18
Cash provided by (used in):
2011
2010
2009
Operating activities
$
59,568
$
49,632
$
98,329
Investing activities
$
(33,449
)
$
(29,550
)
$
(7,585
)
Financing activities
$
(12,237
)
$
(20,886
)
$
(98,672
)