Stein Mart 2011 Annual Report Download - page 13
Download and view the complete annual report
Please find page 13 of the 2011 Stein Mart annual report below. You can navigate through the pages in the report by either clicking on the pages listed below, or by using the keyword search tool below to find specific information within the annual report.-
 1
1 -
2
-
 3
3 -
 4
4 -
 5
5 -
 6
6 -
 7
7 -
 8
8 -
 9
9 -
 10
10 -
 11
11 -
 12
12 -
 13
13 -
 14
14 -
 15
15 -
 16
16 -
 17
17 -
 18
18 -
 19
19 -
 20
20 -
 21
21 -
 22
22 -
 23
23 -
24
-
25
-
26
-
27
-
28
-
29
-
30
-
31
-
32
-
33
-
34
-
35
-
36
-
37
-
38
-
39
-
40
-
41
-
42
-
43
-
44
-
45
-
46
-
47
-
48
-
49
-
50
-
51
-
52
-
53
 |
 |

Table of Contents
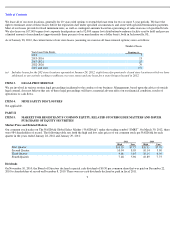
Performance Graph
The following graph compares the cumulative five-year stockholder return on our common stock with the cumulative total return to the
NASDAQ Composite Index and the S&P 500 Apparel Retail Index. The comparison assumes $100 was invested at the beginning of the five
year period in Stein Mart, Inc. stock and in each of the indices shown and assumes reinvestment of any dividends. This year the stock
performance graph reflects a change made by the Company in the peer group comparison index from the Dow Jones US Apparel Retailers
Index to the S&P 500 Apparel Retail Index. Management believes that the companies that comprise the S&P 500 Apparel Retail Index, as a
group, more closely match the Company in terms of customer base and gross revenues.
* * * * *
The stock performance graph should not be deemed filed or incorporated by reference into any other filings made by us under the Securities
Act of 1933 or the Securities Exchange Act of 1934, except to the extent that we specifically incorporate the stock performance graph by
reference in another filing.
11
2/3/2007
2/2/2008
1/31/2009
1/30/2010
1/29/2011
1/28/2012
Stein Mart, Inc.
$
100.0
$
44.4
$
8.9
$
59.8
$
63.5
$
59.1
NASDAQ Composite
100.0
98.3
60.9
89.3
113.0
120.6
S&P 500 Apparel Retail
100.0
97.4
48.8
96.6
126.4
166.7
Dow Jones US Apparel Retailers
100.0
79.0
41.6
78.7
97.5
116.3