Stein Mart 2011 Annual Report Download - page 15
Download and view the complete annual report
Please find page 15 of the 2011 Stein Mart annual report below. You can navigate through the pages in the report by either clicking on the pages listed below, or by using the keyword search tool below to find specific information within the annual report.-
 1
1 -
2
-
3
-
4
-
 5
5 -
 6
6 -
 7
7 -
 8
8 -
 9
9 -
 10
10 -
 11
11 -
 12
12 -
 13
13 -
 14
14 -
 15
15 -
 16
16 -
 17
17 -
 18
18 -
 19
19 -
 20
20 -
 21
21 -
 22
22 -
 23
23 -
 24
24 -
 25
25 -
26
-
27
-
28
-
29
-
30
-
31
-
32
-
33
-
34
-
35
-
36
-
37
-
38
-
39
-
40
-
41
-
42
-
43
-
44
-
45
-
46
-
47
-
48
-
49
-
50
-
51
-
52
-
53
 |
 |

Table of Contents
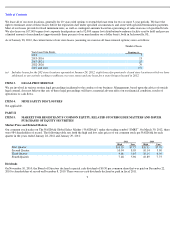
Reconciliations of net income (loss) per diluted share on a GAAP basis to adjusted net income (loss) per diluted share (non-GAAP basis) are
presented in the table below:
We are a national retailer offering the fashion merchandise, service and presentation of a better department or specialty store at prices
comparable to off-price retail chains. Our focused assortment of merchandise features current-season moderate to better fashion apparel for
women and men, as well as accessories, shoes and home fashions.
We report our consolidated financial results in accordance with generally accepted accounting principles (“GAAP”). To supplement these
consolidated financial results, we believe that certain non-GAAP operating results, which exclude the items discussed at Adjusted Results for
Items Impacting Comparability
below, may provide a meaningful measure on which to compare the results of operations between periods.
Wherever used below, the words “as adjusted” or “adjusted” identify financial results excluding these items that impact comparability.
2011 Highlights
Comparable store sales for 2011 decreased 1.1 percent compared to 2010 and total sales decreased 1.8 percent. Net income for 2011 was $19.8
million or $0.44 per diluted share compared to $48.8 million or $1.08 per diluted share for 2010. Net income as adjusted for 2011 was $20.0
million or $0.44 per diluted share compared to $29.6 million or $0.66 per diluted share for 2010.
Cash at year-end 2011 was $94.1 million compared to $80.2 million at year-end 2010. We had no outstanding debt at year-end and had no
borrowings on our credit facility. Inventories were down 5% at the end of 2011 compared to the prior year.
During 2011, we continued to focus on increasing our sales and managing our inventories. We were disappointed with third quarter sales which
were impacted by a shift in our advertising media mix for the largest August promotional event and Hurricane Irene which also disrupted
business during the same event. Coupon usage was reduced by 20 percent during the fourth quarter as part of our long-term strategy to present
our customers with a value proposition more solidly based on our everyday prices. We maintained tight inventory control as we approached the
end of the fiscal year, which left us in a better position entering 2012, but also negatively affected sales at the end of our fourth quarter.
2012 Outlook
We expect the following factors to influence our business in 2012:
13
charges, certain breakage gains, net of a charge associated with changing our physical inventory process and significant tax provision
impacts including the (reversal)/initial recording of a valuation allowance for deferred tax assets, may provide a meaningful measure on
which to compare the results of operations between periods. We believe these non-GAAP results provide useful information to both
management and investors by excluding certain items that impact the comparability of the results.
2011
2010
2009
2008
2007
Net income (loss) per diluted share (GAAP basis)
$
0.44
$
1.08
$
0.54
$
(1.72
)
$
(0.11
)
Adjustments:
Asset impairment and store closing charges, net of tax
0.03
0.06
0.17
0.39
0.07
Correction of reward breakage income related to prior years
(0.03
)
—
—
—
—
Cumulative breakage gain, net of inventory charge
—
(
0.15
)
—
—
—
Valuation allowance for deferred tax assets
–
(
reversal)/initial
—
(
0.13
)
—
0.46
—
Impact of 2011 effective tax rate on 2010*
—
(
0.20
)
—
—
—
Adjustments total
—
(
0.42
)
0.17
0.85
0.07
Adjusted net income (loss) per diluted share (non
-
GAAP basis)
$
0.44
$
0.66
$
0.71
$
(0.87
)
$
(0.04
)
* To make 2011 and 2010 operating results more comparable due to differences in our annual effective tax rate (“ETR”) caused by last year’s
deferred tax valuation allowance, the 2010 tax provision has been adjusted using the 2011 annual ETR of 38 percent.
ITEM 7.
MANAGEMENT
’
S DISCUSSION AND ANALYSIS OF FINANCIAL CONDITION AND RESULTS OF
OPERATIONS
Overview
•
Current plans are to open seven stores, close three stores and relocate five stores to better locations in their respective markets in 2012.
•
The gross profit rate is expected to be lower than in 2011 as it will be impacted by our new pricing strategy and coupon reduction efforts
(see below) to drive long
-
term sales growth as well as inflationary occupancy cost increases.