Stein Mart 2011 Annual Report Download - page 17
Download and view the complete annual report
Please find page 17 of the 2011 Stein Mart annual report below. You can navigate through the pages in the report by either clicking on the pages listed below, or by using the keyword search tool below to find specific information within the annual report.-
 1
1 -
2
-
3
-
4
-
5
-
6
-
 7
7 -
 8
8 -
 9
9 -
 10
10 -
 11
11 -
 12
12 -
 13
13 -
 14
14 -
 15
15 -
 16
16 -
 17
17 -
 18
18 -
 19
19 -
 20
20 -
 21
21 -
 22
22 -
 23
23 -
 24
24 -
 25
25 -
 26
26 -
 27
27 -
28
-
29
-
30
-
31
-
32
-
33
-
34
-
35
-
36
-
37
-
38
-
39
-
40
-
41
-
42
-
43
-
44
-
45
-
46
-
47
-
48
-
49
-
50
-
51
-
52
-
53
 |
 |

Table of Contents
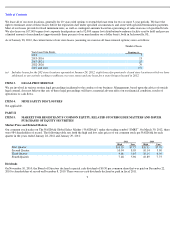
Reconciliations of operating and net income on a GAAP basis to adjusted operating and net income on a non-GAAP basis are presented in the
following table (in thousands):
Asset impairment and store closing charges, including costs to relocate stores, are as follows (dollar amounts in thousands):
2011 Compared to 2010
Net Sales. The following table provides net sales for fiscal 2011 compared to fiscal 2010 (dollar amounts in thousands):
The decrease in sales reflects a $13.0 million decrease in the comparable store group and a $16.3 million decrease in the closed store group,
offset by an $8.2 million increase in the non-comparable store group due to the inclusion of sales for a total of five stores opened in 2011 and
2010. The closed store group includes five stores closed in 2011 and five stores closed in 2010. The comparable store sales decrease was driven
by decreases in the number of transactions and the average units per transaction, offset by an increase in average unit retail prices.
Gross Profit. The following table compares gross profit for fiscal 2011 to fiscal 2010 (dollar amounts in thousands):
The decrease in gross profit reflects a $13.6 million decrease in the comparable store group and a $3.1 million decrease in the closed store
group, offset by a $1.8 million increase in the non-comparable store group. Gross profit as a percent of sales decreased during 2011 primarily
due to higher occupancy and buying costs and the negative leverage on lower sales.
Selling, General and Administrative Expenses. The following table compares SG&A expenses for fiscal 2011 to fiscal 2010 (dollar amounts
in thousands):
15
2011
2010
2009
Operating
Income
Net
Income
Operating
Income
Net
Income
Operating
Income
Net
Income
Income - (GAAP basis)
$
32,257
$
19,828
$
53,530
$
48,753
$
35,059
$
23,553
Adjustments:
Asset impairment and store closing charges
2,322
1,440
3,093
2,448
11,087
7,589
Correction of reward breakage income related to prior years
(2,023
)
(1,244
)
—
—
—
—
Cumulative gift and return card breakage gain, net of inventory
charge
—
—
(
8,481
)
(6,713
)
—
—
Reversal of deferred tax asset valuation allowance
—
—
—
(
5,973
)
—
—
Impact of 2011 higher 38.0% ETR on 2010
—
—
—
(
8,877
)
—
—
Adjusted income
-
(
non
-
GAAP basis)
$
32,556
$
20,024
$
48,142
$
29,638
$
46,146
$
31,142
2011
2010
2009
Asset impairment charges
$
1,166
$
1,150
$
8,429
Lease termination costs, net
663
1,702
2,089
Severance and other
493
241
569
Total
$
2,322
$
3,093
$
11,087
2011
2010
Decrease
Net sales
$
1,160,367
$
1,181,510
$
(21,143
)
Sales percent decrease:
Total net sales
(1.8
)%
Comparable store sales
(1.1
)%
2011
2010
Decrease
Gross profit
$
297,364
$
312,308
$
(14,944
)
Percentage of net sales
25.6
%
26.4
%
(0.8
)%
2011
2010
Increase
Selling, general and administrative expenses
$
289,114
$
288,208
$
906
Percentage of net sales
24.9
%
24.4
%
0.5
%