Stein Mart 2011 Annual Report Download - page 18
Download and view the complete annual report
Please find page 18 of the 2011 Stein Mart annual report below. You can navigate through the pages in the report by either clicking on the pages listed below, or by using the keyword search tool below to find specific information within the annual report.-
 1
1 -
2
-
3
-
4
-
5
-
6
-
7
-
 8
8 -
 9
9 -
 10
10 -
 11
11 -
 12
12 -
 13
13 -
 14
14 -
 15
15 -
 16
16 -
 17
17 -
 18
18 -
 19
19 -
 20
20 -
 21
21 -
 22
22 -
 23
23 -
 24
24 -
 25
25 -
 26
26 -
 27
27 -
 28
28 -
29
-
30
-
31
-
32
-
33
-
34
-
35
-
36
-
37
-
38
-
39
-
40
-
41
-
42
-
43
-
44
-
45
-
46
-
47
-
48
-
49
-
50
-
51
-
52
-
53
 |
 |

Table of Contents
Excluding pre-tax asset impairment and store closing charges in both years and the $1.2 million charge associated with changing our physical
inventory process in 2010, SG&A expenses increased to $286.8 million or 24.7 percent of sales from $283.9 million or 24.0 percent of sales for
2010. The $2.9 million increase in SG&A expenses as adjusted includes a $2.9 million increase in advertising expenses, a $2.6 million increase
in corporate expenses and a $0.9 million increase in depreciation expense, offset by a $3.5 million decrease in stores expenses. The increase in
corporate expenses include unfavorable market value changes in the cash surrender value of insurance contracts underlying our executive split-
dollar insurance plans for 2011 compared to 2010 and higher information systems expenses. Store expense reductions include $3.5 million for
the elimination of operating costs from closed stores and a $1.0 million savings in credit card interchange fees, offset by increases in other store
expenses. Asset impairment and store closing charges were $0.8 million lower this year due to lower lease termination fees incurred this year.
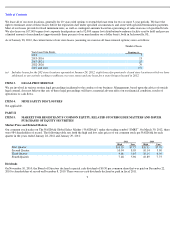
Other income, net. The following table compares other income, net for fiscal 2011 to fiscal 2010 (dollar amounts in thousands):
Other income for 2011 includes a first quarter pre-tax gain of $2.0 million to correct an error in our liability for credit card rewards. The error
was due to inaccuracies in the data used to calculate breakage income for expired rewards in fiscal years 2008 through 2010, which overstated
the rewards liability and understated income for those periods. Other income for 2010 includes $9.7 million for the recognition of income
related to cumulative breakage on unused gift and merchandise return cards since the inception of these programs. Other income as adjusted for
these items was $22.0 million for 2011 compared to $19.7 million for 2010. The $2.3 million increase in adjusted other income includes higher
income in 2011 from the credit card program, including a $1.6 million performance-based incentive related to the final program year of our
prior co-brand program agreement, and higher leased shoe department income.
Under our October 2011 amended credit card agreement, we are no longer receiving new account fees. New account fees were $2.7 million in
2011 and $3.0 million in 2010. As we introduce our private label credit card, we expect increased spending and sales lift from the additional
credit card customers to offset the loss of new account fees over time.
Income Taxes. The following table compares income tax expense for fiscal 2011 to fiscal 2010 (dollar amounts in thousands):
Income tax expense for 2010 was favorably impacted by the reversal of the remaining $6.0 million deferred tax asset valuation allowance
established in 2008. Excluding this favorable tax adjustment, the ETR was 19.6 percent in 2010, which was lower than the federal statutory rate
of 35.0 percent due to the impact of favorable changes in book/tax differences on the valuation allowance prior to the year-end reversal and
favorable settlements of state income tax examinations. During 2011, there was no valuation allowance impact and as a result, we returned to a
normalized ETR. Income tax expense for 2010 calculated using the 2011 normalized ETR of 38.0 percent would be $8.9 million higher.
2010 Compared to 2009
Net Sales. The following table provides net sales for fiscal 2010 compared to fiscal 2009 (dollar amounts in thousands):
The decrease in sales reflects a $20.7 million decrease in the comparable store group and a $26.0 million decrease in the closed store group,
offset by a $9.1 million increase in the non-comparable store group due to the inclusion of sales for a total of four stores opened in 2010 and
2009. The closed store group includes 5 stores closed in 2010 and 11 stores closed in 2009. The comparable store sales decrease was driven by
decreases in the number of transactions and the average units per transaction, offset by an increase in average unit retail.
16
2011
2010
Decrease
Other income, net
$
24,007
$
29,430
$
(5,423
)
Percentage of net sales
2.1
%
2.5
%
(0.4
)%
2011
2010
Increase
Income tax expense
$
12,143
$
4,439
$
7,704
Effective tax rate
38.0
%
8.3
%
29.7
%
2010
2009
Decrease
Net sales
$
1,181,510
$
1,219,109
$
(37,599
)
Sales percent decrease:
Total net sales
(3.1
)%
Comparable store sales
(1.8
)%