Snapple 2009 Annual Report Download - page 4
Download and view the complete annual report
Please find page 4 of the 2009 Snapple annual report below. You can navigate through the pages in the report by either clicking on the pages listed below, or by using the keyword search tool below to find specific information within the annual report.-
 1
1 -
 2
2 -
 3
3 -
 4
4 -
 5
5 -
 6
6 -
 7
7 -
 8
8 -
 9
9 -
 10
10 -
 11
11 -
 12
12 -
 13
13 -
 14
14 -
 15
15 -
16
-
17
-
18
-
19
-
20
-
21
-
22
-
23
-
24
-
25
-
26
-
27
-
28
-
29
-
30
-
31
-
32
-
33
-
34
-
35
-
36
-
37
-
38
-
39
-
40
-
41
-
42
-
43
-
44
-
45
-
46
-
47
-
48
-
49
-
50
-
51
-
52
-
53
-
54
-
55
-
56
-
57
-
58
-
59
-
60
-
61
-
62
-
63
-
64
-
65
-
66
-
67
-
68
-
69
-
70
-
71
-
72
-
73
-
74
-
75
-
76
-
77
-
78
-
79
-
80
-
81
-
82
-
83
-
84
-
85
-
86
-
87
-
88
-
89
-
90
-
91
-
92
-
93
-
94
-
95
-
96
-
97
-
98
-
99
-
100
-
101
-
102
-
103
-
104
-
105
-
106
-
107
-
108
-
109
-
110
-
111
-
112
-
113
-
114
-
115
-
116
-
117
-
118
-
119
-
120
-
121
-
122
-
123
-
124
-
125
-
126
-
127
-
128
-
129
-
130
-
131
-
132
-
133
-
134
-
135
-
136
-
137
-
138
-
139
-
140
-
141
-
142
-
143
-
144
-
145
-
146
-
147
-
148
-
149
-
150
-
151
-
152
-
153
-
154
-
155
-
156
-
157
-
158
-
159
-
160
 |
 |

Against a challenging economic backdrop, Dr Pepper Snapple continues to create shareholder value,
as shown in our relative price performance vs. the S&P 500 Index in 2009.
20 09 DPS SH ARE HOL DER RETURN
80%
60%
40%
20%
0%
-20%
Jan Feb Mar Apr May Jun Jul Aug Sep Oct Nov Dec
S&P
DPS
Our accomplishments in 2009 are just a
taste of those to come, and we are energized
by the knowledge that our journey is just
beginning. The actions we have taken this
year will build a foundation for long-term
growth that will sustain our company well
into the future.
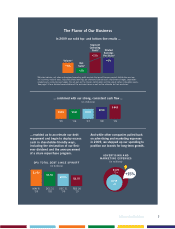
The Flavor of Growth
Macroeconomic conditions provided a
challenging backdrop for the beverage
industry in 2009. Sales of liquid refreshment
beverages (LRBs) declined for the second
consecutive year, while consumer spending
remained weak and shoppers continued
to gravitate toward value. Despite these
challenges, Dr Pepper Snapple Group
focused on finding new ways to win, and
the result was strong business performance,
as we were the only major beverage company
to increase our share of LRBs in 2009.
Net sales increased 2 percent on a currency-
neutral basis and excluding the loss of a
licensed brand that we no longer distribute.
Driving the top-line improvement were price
increases and 4 percent sales volume growth,
partially offset by negative mix from higher
sales of CSD concentrates and value juices.
Strong performance across multiple brands
contributed to the volume growth, with
CSDs up 4 percent and our non-carbonated
beverages up 2 percent. Dr Pepper volume
increased 2 percent, largely driven by Diet
Dr Pepper and the launch of Dr Pepper
Cherry. Among our Core 4 brands, Canada
Dry was up mid single digits and 7UP and
A&W grew low single digits, while Sunkist
soda declined high single digits. Crush
volume more than doubled, adding 48
million cases in 2009 through expanded
third-party distribution in the U.S. and the
launch of Crush value offerings in Mexico.
Our leadership in the juice aisle continued
on the strength of Hawaiian Punch and
Mott’s, with volume gains of 14 percent
and 8 percent, respectively. Our premium-
priced products continued to be negatively
impacted as consumers shifted to value
offerings. Snapple volume was down
11 percent for the year, but sales trends
are strengthening and the brand improved
sequentially for the last three quarters
of 2009.
In Mexico, we grew our share of flavored
CSDs. The restage of Peñafiel flavors and
expanded distribution for the brand resulted
in a mid single-digit increase in Peñafiel
volume, while Squirt declined high single
digits. We also grew share of Clamato
and flavored CSDs in Canada, particularly
Dr Pepper, where expanded programming
and trial contributed to double-digit
volume growth for the brand.
Segment operating profit on a comparable
basis increased 17 percent on the strength
of the sales gain and lower packaging,
ingredient and transportation costs.
Excluding certain items, we earned $1.97
per diluted share, an increase of more than
6 percent compared to 2008.
DR PEPPER SNAPPLE GROUP 2009 ANNUAL REPORT
2
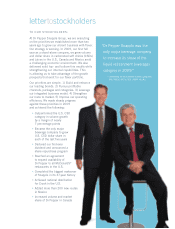
letter to stockholders