Snapple 2009 Annual Report Download - page 2
Download and view the complete annual report
Please find page 2 of the 2009 Snapple annual report below. You can navigate through the pages in the report by either clicking on the pages listed below, or by using the keyword search tool below to find specific information within the annual report.-
 1
1 -
 2
2 -
 3
3 -
 4
4 -
 5
5 -
 6
6 -
 7
7 -
 8
8 -
 9
9 -
 10
10 -
 11
11 -
 12
12 -
 13
13 -
14
-
15
-
16
-
17
-
18
-
19
-
20
-
21
-
22
-
23
-
24
-
25
-
26
-
27
-
28
-
29
-
30
-
31
-
32
-
33
-
34
-
35
-
36
-
37
-
38
-
39
-
40
-
41
-
42
-
43
-
44
-
45
-
46
-
47
-
48
-
49
-
50
-
51
-
52
-
53
-
54
-
55
-
56
-
57
-
58
-
59
-
60
-
61
-
62
-
63
-
64
-
65
-
66
-
67
-
68
-
69
-
70
-
71
-
72
-
73
-
74
-
75
-
76
-
77
-
78
-
79
-
80
-
81
-
82
-
83
-
84
-
85
-
86
-
87
-
88
-
89
-
90
-
91
-
92
-
93
-
94
-
95
-
96
-
97
-
98
-
99
-
100
-
101
-
102
-
103
-
104
-
105
-
106
-
107
-
108
-
109
-
110
-
111
-
112
-
113
-
114
-
115
-
116
-
117
-
118
-
119
-
120
-
121
-
122
-
123
-
124
-
125
-
126
-
127
-
128
-
129
-
130
-
131
-
132
-
133
-
134
-
135
-
136
-
137
-
138
-
139
-
140
-
141
-
142
-
143
-
144
-
145
-
146
-
147
-
148
-
149
-
150
-
151
-
152
-
153
-
154
-
155
-
156
-
157
-
158
-
159
-
160
 |
 |

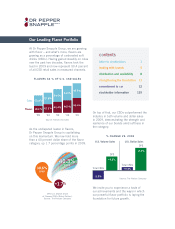
Our Leading Flavor Portfolio
At Dr Pepper Snapple Group, we are growing
with flavor
—
and what’s more, flavors are
growing as a percentage of carbonated soft
drinks (CSDs). Having gained steadily on colas
over the past two decades, flavors took the
lead in 2009 and now represent 50.4 percent
of all CSD retail sales in measured channels.
contents
letter to stockholders 1
leading with brands 5
distribution and availability 8
strengthening the foundation 11
commitment to csr 12
stockholder information 139
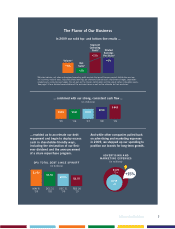
On top of that, our CSDs outperformed the
industry in both volume and dollar sales
in 2009, demonstrating the strength and
resilience of our brands amid softness in
the category.
We invite you to experience a taste of
our achievements and the ways in which
our powerful flavor portfolio is laying the
foundation for future growth.
% CHA NGE VS . 20 08
Source: The Nielsen Company
U.S. Volume Sales
Total CSDs
DPS
U.S. Dollar Sales
+4.2%
+0.8%
Total CSDs
-2.5%
DPS
+7.0%
FL AVORS AS % OF U.S. C SD SALES
40.3%
2009
+1.7%
As the undisputed leader in flavors,
Dr Pepper Snapple Group is capitalizing
on this momentum. We now hold more
than a 40 percent dollar share of the flavor
category, up 1.7 percentage points in 2009.
DPS U.S. Market Share
of Flavored CSDs (Retail Dollars).
Source: The Nielsen Company
38.6%
2008
Source: Nielsen estimates
Colas
’89
Flavors
’94 ’99 ’04 ’09
39.2%
60.8%
42.2% 45.4% 46.0% 50.4%
49.6%
57.8%
54.6%
54.0%