Qantas 2002 Annual Report Download - page 46
Download and view the complete annual report
Please find page 46 of the 2002 Qantas annual report below. You can navigate through the pages in the report by either clicking on the pages listed below, or by using the keyword search tool below to find specific information within the annual report.-
 1
1 -
2
-
3
-
4
-
5
-
6
-
7
-
8
-
9
-
10
-
11
-
12
-
13
-
14
-
15
-
16
-
17
-
18
-
19
-
20
-
21
-
22
-
23
-
24
-
25
-
26
-
27
-
28
-
29
-
30
-
31
-
32
-
33
-
34
-
35
-
 36
36 -
 37
37 -
 38
38 -
 39
39 -
 40
40 -
 41
41 -
 42
42 -
 43
43 -
 44
44 -
 45
45 -
 46
46 -
 47
47 -
 48
48 -
 49
49 -
 50
50 -
 51
51 -
 52
52 -
 53
53 -
 54
54 -
 55
55 -
 56
56
 |
 |
notes to the financial statements continued
for the year ended 30 June 2002
p44 THE SPIRIT OF AUSTRALIA
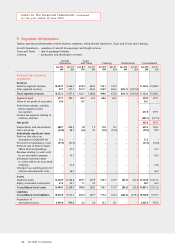
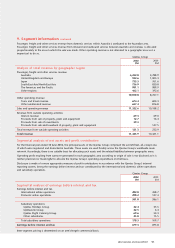
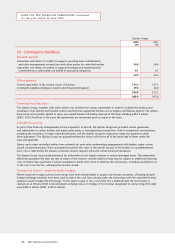
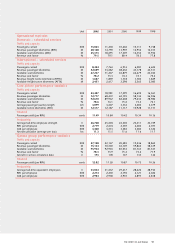
9. Segment information
Qantas operates predominantly in three business segments, being Aircraft Operations, Tours and Travel, and Catering.
Aircraft Operations – operation of aircraft for passenger and freight services.
Tours and Travel – sale of packaged holidays.
Catering – production and distribution of meals.
Aircraft Tours
Operations and Travel Catering Eliminations Consolidated
Jun 02 Jun 01 Jun 02 Jun 01 Jun 02 Jun 01 Jun 02 Jun 01 Jun 02 Jun 01
$M $M $M $M $M $M $M $M $M $M
Analysis by business
segments
Revenue
External segment revenue
10,494.1 9,436.5 674.4 604.3 154.1 147.4 ––11,322.6 10,188.2
Inter-segment revenue
29.1 271.1 451.7 424.3 335.9 306.4 (816.7) (1,001.8) ––
Total segment revenue
10,523.2 9,707.6 1,126.1 1,028.6 490.0 453.8 (816.7) (1,001.8) 11,322.6 10,188.2
Segment result
477.1 490.1 49.2 44.5 68.6 62.5 ––594.9 597.1
Share of net profit of associates
35.4 –0.7 –––––36.1 –
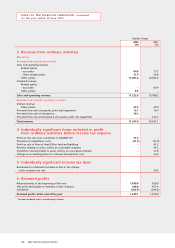
Profit from ordinary activities
before related income
tax expense
631.0 597.1
Income tax expense relating to
ordinary activities
(201.7) (177.4)
Net profit
429.3 419.7
Depreciation and amortisation
680.7 696.5 1.8 1.9 11.0 8.3 ––693.5 706.7
Non-cash items
(45.8) 68.7 (1.6) 0.2 (1.8) (19.0) ––(49.2) 49.9
Individually significant items
Profit on the sale of an
investment in EQUANT NV
31.2 –––––––31.2 –
Provision for redundancy costs
(41.5) (35.0) ––––––(41.5) (35.0)
Profit on sale of Mascot Head
Office land and buildings
–41.2 –––––––41.2
Revenue relating to assets sold
by an associated company
–43.3 –––––––43.3
Dividends received related
to assets sold by an associated
company
–31.8 –––––––31.8
Change in accounting policy for
software development costs
–46.0 –––––––46.0
Assets
Segment assets
14,342.9 12,166.8 307.7 227.9 176.7 131.9 (84.5) (55.4) 14,742.8 12,471.2
Equity accounted investments
57.6 42.1 1.1 0.3 ––––58.7 42.4
Consolidated total assets
14,400.5 12,208.9 308.8 228.2 176.7 131.9 (84.5) (55.4) 14,801.5 12,513.6
Liabilities
Consolidated total liabilities
10,442.0 9,014.7 254.4 207.7 117.2 124.4 (265.6) (149.1) 10,548.0 9,197.7
Acquisition of
non-current assets
2,445.8 984.8 2.3 2.6 15.3 8.1 ––2,463.4 995.5