Qantas 2002 Annual Report Download - page 36
Download and view the complete annual report
Please find page 36 of the 2002 Qantas annual report below. You can navigate through the pages in the report by either clicking on the pages listed below, or by using the keyword search tool below to find specific information within the annual report.-
 1
1 -
2
-
3
-
4
-
5
-
6
-
7
-
8
-
9
-
10
-
11
-
12
-
13
-
14
-
15
-
16
-
17
-
18
-
19
-
20
-
21
-
22
-
23
-
24
-
25
-
 26
26 -
 27
27 -
 28
28 -
 29
29 -
 30
30 -
 31
31 -
 32
32 -
 33
33 -
 34
34 -
 35
35 -
 36
36 -
 37
37 -
 38
38 -
 39
39 -
 40
40 -
 41
41 -
 42
42 -
 43
43 -
 44
44 -
 45
45 -
 46
46 -
47
-
48
-
49
-
50
-
51
-
52
-
53
-
54
-
55
-
56
 |
 |

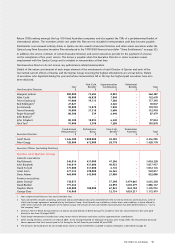
p34 2002 QANTAS ANNUAL REPORT
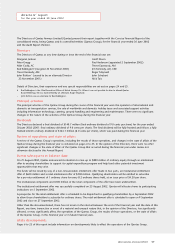
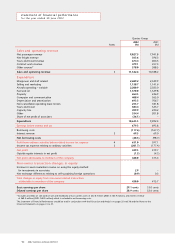
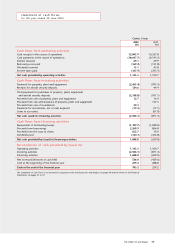
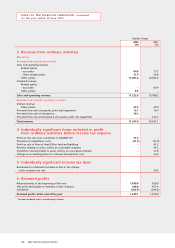
statement of financial performance
for the year ended 30 June 2002
Qantas Group
2002 2001
Notes $M $M
Sales and operating revenue
Net passenger revenue 9,027.5 7,941.8
Net freight revenue 563.6 596.3
Tours and travel revenue 674.4 604.3
Contract work revenue 479.1 457.3
Other sources* 578.0 588.5
Sales and operating revenue 311,322.6 10,188.2
Expenditure
Manpower and staff related 2,689.2 2,549.9
Selling and marketing 1,158.7 1,141.6
Aircraft operating – variable 2,200.9 2,023.0
Fuel and oil 1,570.0 1,329.8
Property 264.3 246.9
Computer and communication 408.4 365.0
Depreciation and amortisation 693.5 706.7
Non-cancellable operating lease rentals 255.7 181.8
Tours and travel 584.4 525.7
Capacity hire 499.9 220.2
Other 354.4 201.8
Share of net profit of associates (36.1) –
Expenditure 10,643.3 9,492.4
Earnings before interest and tax 679.3 695.8
Borrowing costs (117.6) (167.7)
Interest revenue 3 69.3 69.0
Net borrowing costs (48.3) (98.7)
Profit from ordinary activities before related income tax expense 4631.0 597.1
Income tax expense relating to ordinary activities 5 (201.7) (177.4)
Net profit 429.3 419.7
Outside equity interests in net profit (1.3) (4.3)
Net profit attributable to members of the company 428.0 415.4
Non-owner transaction changes in equity
Increase in asset revaluation reserve on using the equity method
for investments in associates 2.9 –
Net exchange differences relating to self-sustaining foreign operations (0.9) 0.3
Total changes in equity from non-owner related transactions
attributable to members of the company 430.0 415.7
Basic earnings per share 29.1 cents 33.0 cents
Diluted earnings per share 28.9 cents 32.6 cents
* Excludes proceeds on sale (and on sale and leaseback) of non-current assets of $52.0 million (2001: $163.9 million), and interest revenue
of $69.3 million (2001: $69.0 million) which is included in net borrowing costs.
The Statement of Financial Performance should be read in conjunction with the Discussion and Analysis on pages 35 and 36 and the Notes to the
Financial Statements on pages 41 to 47.