Qantas 2002 Annual Report Download - page 37
Download and view the complete annual report
Please find page 37 of the 2002 Qantas annual report below. You can navigate through the pages in the report by either clicking on the pages listed below, or by using the keyword search tool below to find specific information within the annual report.-
 1
1 -
2
-
3
-
4
-
5
-
6
-
7
-
8
-
9
-
10
-
11
-
12
-
13
-
14
-
15
-
16
-
17
-
18
-
19
-
20
-
21
-
22
-
23
-
24
-
25
-
26
-
 27
27 -
 28
28 -
 29
29 -
 30
30 -
 31
31 -
 32
32 -
 33
33 -
 34
34 -
 35
35 -
 36
36 -
 37
37 -
 38
38 -
 39
39 -
 40
40 -
 41
41 -
 42
42 -
 43
43 -
 44
44 -
 45
45 -
 46
46 -
 47
47 -
48
-
49
-
50
-
51
-
52
-
53
-
54
-
55
-
56
 |
 |

THE SPIRIT OF AUSTRALIA p35
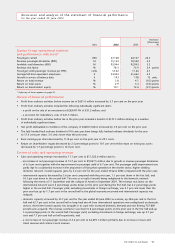
Increase/
(Decrease)
Unit 2002 2001 %
Qantas Group operational statistics
and performance indicators*
Passengers carried 000 27,128 22,147 22.5
Revenue passenger kilometres (RPK) M 75,134 70,540 6.5
Available seat kilometres (ASK) M 95,944 92,943 3.2
Revenue seat factor % 78.3 75.9 2.4 points
Passenger yield (passenger revenue per RPK) cents 12.02 11.26 6.7
Average full-time equivalent employees # 33,044 31,632 4.5
Aircraft in service at balance date # 193 178 15 units
Return on total revenue % 3.8 4.1 (0.3) points
Return on total assets % 2.9 3.3 (0.4) points
Return on shareholders’ equity % 10.1 12.6 (2.5) points
* A glossary of terms appears on page 52.
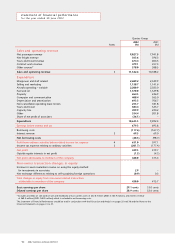
Review of financial performance
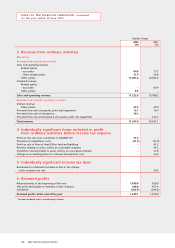
•Profit from ordinary activities before income tax of $631.0 million increased by 5.7 per cent on the prior year.
•Profit from ordinary activities included the following individually significant items:
– a profit on the sale of an investment in EQUANT NV of $31.2 million; and
– a provision for redundancy costs of $41.5 million.
•Profit from ordinary activities before tax in the prior year included a benefit of $127.3 million relating to a number
of individually significant items.
•Net profit attributable to members of the company of $428.0 million increased by 3.0 per cent on the prior year.
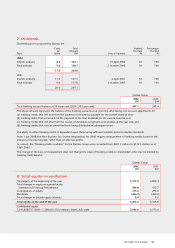
•The fully franked final ordinary dividend of 9.0 cents per share brings fully franked ordinary dividends for the year
to 17.0 cents per share, 3.0 cents lower than the prior year.
•Basic earnings per share decreased by 11.8 per cent on the prior year to 29.1 cents.
•Return on shareholders’ equity decreased by 2.5 percentage points to 10.1 per cent whilst return on total gross assets
decreased by 1.7 percentage points to 12.0 per cent.
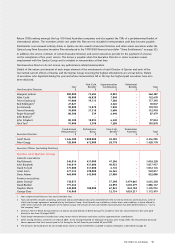
Review of sales and operating revenue
•Sales and operating revenue increased by 11.1 per cent to $11,322.6 million due to:
– an increase in net passenger revenue of 13.7 per cent to $9,027.5 million due to growth in revenue passenger kilometres
of 6.5 per cent together with the improvement in passenger yield of 6.7 per cent. The passenger yield improvement was
partly due to a substantial increase in the proportion of flying that operated on the shorter sector, higher yielding
domestic network. Overall capacity grew by 3.2 per cent for the year ended 30 June 2002 compared with the prior year;
– international capacity decreased by 5.6 per cent compared with the prior year, 1.1 per cent down in the first half, and
10.1 per cent down in the second half. This was as a result of aircraft being redeployed to the domestic network
following the events of 11 September and the collapse of Ansett in September 2001. The revenue seat factor on the
international network was 0.2 percentage points down on the prior year during the first half, but 6.2 percentage points
higher in the second half. Passenger yield, excluding movements in foreign exchange, was 2.1 per cent lower than the
prior year but up by 1.7 per cent in the second half as the global economy recovered and international capacity was
reduced;
– domestic capacity increased by 35.7 per cent for the year ended 30 June 2002 as a whole, up 28.6 per cent in the first
half and 42.7 per cent in the second half as long-haul aircraft from international operations were redeployed on domestic
sectors, short-term leased capacity was brought in to cope with increased domestic demand and new Boeing 737-800
aircraft were acquired. The revenue seat factor was down 0.8 percentage points on the prior year in the first half and up
1.6 percentage points in the second half. Passenger yield, excluding movements in foreign exchange, was up 5.7 per
cent and 7.7 per cent half on half respectively; and
– a net increase in non-passenger revenue of 2.2 per cent to $2,295.1 million primarily due to increases in tours and
travel revenue and contract work revenue.
discussion and analysis of the statement of financial performance
for the year ended 30 June 2002