Pfizer 2010 Annual Report Download - page 87
Download and view the complete annual report
Please find page 87 of the 2010 Pfizer annual report below. You can navigate through the pages in the report by either clicking on the pages listed below, or by using the keyword search tool below to find specific information within the annual report.-
 1
1 -
2
-
3
-
4
-
5
-
6
-
7
-
8
-
9
-
10
-
11
-
12
-
13
-
14
-
15
-
16
-
17
-
18
-
19
-
20
-
21
-
22
-
23
-
24
-
25
-
26
-
27
-
28
-
29
-
30
-
31
-
32
-
33
-
34
-
35
-
36
-
37
-
38
-
39
-
40
-
41
-
42
-
43
-
44
-
45
-
46
-
47
-
48
-
49
-
50
-
51
-
52
-
53
-
54
-
55
-
56
-
57
-
58
-
59
-
60
-
61
-
62
-
63
-
64
-
65
-
66
-
67
-
68
-
69
-
70
-
71
-
72
-
73
-
74
-
75
-
76
-
 77
77 -
 78
78 -
 79
79 -
 80
80 -
 81
81 -
 82
82 -
 83
83 -
 84
84 -
 85
85 -
 86
86 -
 87
87 -
 88
88 -
 89
89 -
 90
90 -
 91
91 -
 92
92 -
 93
93 -
 94
94 -
 95
95 -
 96
96 -
 97
97 -
98
-
99
-
100
-
101
-
102
-
103
-
104
-
105
-
106
-
107
-
108
-
109
-
110
-
111
-
112
-
113
-
114
-
115
-
116
-
117
-
118
-
119
-
120
 |
 |

Notes to Consolidated Financial Statements
Pfizer Inc. and Subsidiary Companies
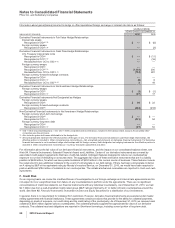
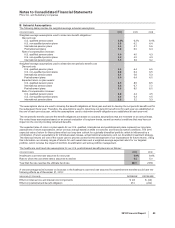
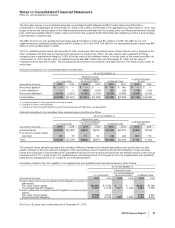
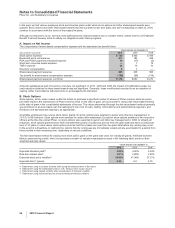
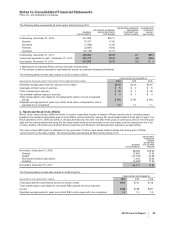
B. Actuarial Assumptions
The following table provides the weighted-average actuarial assumptions:
(PERCENTAGES) 2010 2009 2008
Weighted-average assumptions used to determine benefit obligations:
Discount rate:
U.S. qualified pension plans 5.9% 6.3% 6.4%
U.S. non-qualified pension plans 5.8 6.2 6.4
International pension plans 4.8 5.1 5.6
Postretirement plans 5.6 6.0 6.4
Rate of compensation increase:
U.S. qualified pension plans 4.0 4.0 4.3
U.S. non-qualified pension plans 4.0 4.0 4.3
International pension plans 3.5 3.6 3.2
Weighted-average assumptions used to determine net periodic benefit cost:
Discount rate:
U.S. qualified pension plans 6.3 6.4 6.5
U.S. non-qualified pension plans 6.2 6.4 6.5
International pension plans 5.1 5.6 5.3
Postretirement plans 6.0 6.4 6.5
Expected return on plan assets:
U.S. qualified pension plans 8.5 8.5 8.5
International pension plans 6.4 6.7 7.2
Postretirement plans 8.5 8.5 8.5
Rate of compensation increase:
U.S. qualified pension plans 4.0 4.3 4.5
U.S. non-qualified pension plans 4.0 4.3 4.5
International pension plans 3.6 3.2 3.3
The assumptions above are used to develop the benefit obligations at fiscal year-end and to develop the net periodic benefit cost for
the subsequent fiscal year. Therefore, the assumptions used to determine net periodic benefit cost for each year are established at
the end of each previous year, while the assumptions used to determine benefit obligations are established at each year-end.
The net periodic benefit cost and the benefit obligations are based on actuarial assumptions that are reviewed on an annual basis.
We revise these assumptions based on an annual evaluation of long-term trends, as well as market conditions that may have an
impact on the cost of providing retirement benefits.
The expected rates of return on plan assets for our U.S. qualified, international and postretirement plans represent our long-term
assessment of return expectations, which we may change based on shifts in economic and financial market conditions. The 2010
expected rates of return for these plans reflect our long-term outlook for a globally diversified portfolio, which is influenced by a
combination of return expectations for individual asset classes, actual historical experience and our diversified investment strategy.
The historical returns are one of the inputs used to provide context for the development of our expectations for future returns. Using
this information, we develop ranges of returns for each asset class and a weighted-average expected return for our targeted
portfolio, which includes the impact of portfolio diversification and active portfolio management.
The healthcare cost trend rate assumptions for our U.S. postretirement benefit plans are as follows:
(PERCENTAGES) 2010 2009
Healthcare cost trend rate assumed for next year 8.0% 8.6%
Rate to which the cost trend rate is assumed to decline 4.5 5.0
Year that the rate reaches the ultimate trend rate 2027 2018
A one-percentage-point increase or decrease in the healthcare cost trend rate assumed for postretirement benefits would have the
following effects as of December 31, 2010:
(MILLIONS OF DOLLARS) INCREASE DECREASE
Effect on total service and interest cost components $ 28 $ (24)
Effect on postretirement benefit obligation 272 (242)
2010 Financial Report 85