Pepsi 2014 Annual Report Download - page 9
Download and view the complete annual report
Please find page 9 of the 2014 Pepsi annual report below. You can navigate through the pages in the report by either clicking on the pages listed below, or by using the keyword search tool below to find specific information within the annual report.-
 1
1 -
 2
2 -
 3
3 -
 4
4 -
 5
5 -
 6
6 -
 7
7 -
 8
8 -
 9
9 -
 10
10 -
 11
11 -
 12
12 -
 13
13 -
 14
14 -
 15
15 -
 16
16 -
 17
17 -
 18
18 -
 19
19 -
 20
20 -
21
-
22
-
23
-
24
-
25
-
26
-
27
-
28
-
29
-
30
-
31
-
32
-
33
-
34
-
35
-
36
-
37
-
38
-
39
-
40
-
41
-
42
-
43
-
44
-
45
-
46
-
47
-
48
-
49
-
50
-
51
-
52
-
53
-
54
-
55
-
56
-
57
-
58
-
59
-
60
-
61
-
62
-
63
-
64
-
65
-
66
-
67
-
68
-
69
-
70
-
71
-
72
-
73
-
74
-
75
-
76
-
77
-
78
-
79
-
80
-
81
-
82
-
83
-
84
-
85
-
86
-
87
-
88
-
89
-
90
-
91
-
92
-
93
-
94
-
95
-
96
-
97
-
98
-
99
-
100
-
101
-
102
-
103
-
104
-
105
-
106
-
107
-
108
-
109
-
110
-
111
-
112
-
113
-
114
-
115
-
116
-
117
-
118
-
119
-
120
-
121
-
122
-
123
-
124
-
125
-
126
-
127
-
128
-
129
-
130
-
131
-
132
-
133
-
134
-
135
-
136
-
137
-
138
-
139
-
140
-
141
-
142
-
143
-
144
-
145
-
146
-
147
-
148
-
149
-
150
-
151
-
152
-
153
-
154
-
155
-
156
-
157
-
158
-
159
-
160
-
161
-
162
-
163
-
164
-
165
-
166
 |
 |

2014 ANNUAL REPORT 7
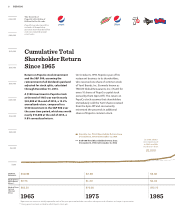
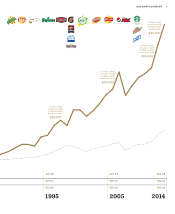
77companies, PepsiCo ranks in the top quartile
in Total Shareholder Returns — a performance
history we reflect on with pride as we celebrate
our50th year.
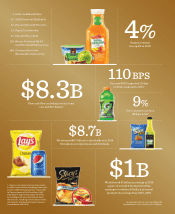
2014 — A Strong Performance Year
PepsiCo delivered strong performance in 2014,
meeting or exceeding all of our full-year finan-
cial targets.
• Organic revenue grew 4%, with PepsiCo
outpacing other Consumer Packaged Goods
companies in organic revenue growth.
• Core gross margins improved by 55 basis
points, and core operating margins improved
by30basis points.
• Core net return on invested capital (ROIC)
improved 110 basis points, to 17.5%.
• Core constant currency earnings per share
(EPS)grew 9%.
• Free cash flow excluding certain items was
strong at $8.3billion.
• PepsiCo increased its annual dividend for
the 42nd consecutive year in 2014 and returned
$8.7billion to our shareholders through share repur-
chases and dividends, a 36% increase over 2013.
While delivering this strong financial perfor-
mance, we continue to deliver progress on the
fundamental global capabilities that underpin our
long-term competitiveness and resilience in the
transformation journey we have been on.
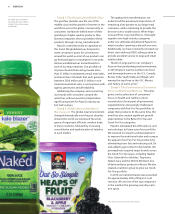
First, our investment in innovation resulted in
strong retail sales in North America. Thanks to our
world-class research and development capabili-
ties and the strength of our new product pipeline,
innovation accounted for more than 9% of our net
revenue in 2014, versus more than 7% in 2012. These
efforts, combined with new best-in-class selling
tools and technologies, made PepsiCo the largest
contributor to U.S. retail sales growth among all food
and beverage manufacturers, with nearly $1billion of
retail sales growth in all measured channels — more
than the next 27 largest manufacturers combined.
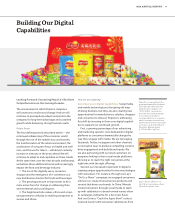
Innovation is a critical
building block in our growth
model. Pictured: PepsiCo
innovation in North America.
>9%
Innovation accounted
for more than 9% of our
net revenue in 2014.
3. This comparison is based on publicly available data for the period
January2, 1974 through December31, 2014 and reects dividend
reinvestment and adjustments for stock splits.
4. Organic, core and constant currency results, as well as free cash ow
excluding certain items, are non-GAAP nancial measures. Please refer
to “Reconciliation of GAAP and Non-GAAP Information” beginning on
page141of this Annual Report for more information about these results,
including a reconciliation to the most directly comparable nancial
measuresin accordance with GAAP.
5. Our organic revenue calculation may dier from similar measures as
reported by other companies.
6. Based in part on data reported by Information Resources, Inc. through
itsSyndicated Advantage Service for the Total US Multi-Outlet Plus
Convenience for all Food & Beverage categories for the 52-week period
ending December28, 2014, including PepsiCo’s custom research denitions.