Pepsi 2014 Annual Report Download - page 4
Download and view the complete annual report
Please find page 4 of the 2014 Pepsi annual report below. You can navigate through the pages in the report by either clicking on the pages listed below, or by using the keyword search tool below to find specific information within the annual report.-
 1
1 -
 2
2 -
 3
3 -
 4
4 -
 5
5 -
 6
6 -
 7
7 -
 8
8 -
 9
9 -
 10
10 -
 11
11 -
 12
12 -
 13
13 -
 14
14 -
 15
15 -
16
-
17
-
18
-
19
-
20
-
21
-
22
-
23
-
24
-
25
-
26
-
27
-
28
-
29
-
30
-
31
-
32
-
33
-
34
-
35
-
36
-
37
-
38
-
39
-
40
-
41
-
42
-
43
-
44
-
45
-
46
-
47
-
48
-
49
-
50
-
51
-
52
-
53
-
54
-
55
-
56
-
57
-
58
-
59
-
60
-
61
-
62
-
63
-
64
-
65
-
66
-
67
-
68
-
69
-
70
-
71
-
72
-
73
-
74
-
75
-
76
-
77
-
78
-
79
-
80
-
81
-
82
-
83
-
84
-
85
-
86
-
87
-
88
-
89
-
90
-
91
-
92
-
93
-
94
-
95
-
96
-
97
-
98
-
99
-
100
-
101
-
102
-
103
-
104
-
105
-
106
-
107
-
108
-
109
-
110
-
111
-
112
-
113
-
114
-
115
-
116
-
117
-
118
-
119
-
120
-
121
-
122
-
123
-
124
-
125
-
126
-
127
-
128
-
129
-
130
-
131
-
132
-
133
-
134
-
135
-
136
-
137
-
138
-
139
-
140
-
141
-
142
-
143
-
144
-
145
-
146
-
147
-
148
-
149
-
150
-
151
-
152
-
153
-
154
-
155
-
156
-
157
-
158
-
159
-
160
-
161
-
162
-
163
-
164
-
165
-
166
 |
 |

$100
$5,000
$10,000
$15,000
$20,000
$25,000
$30,000
$35,000
$40,000
$45,000
PEP Net
Revenue*
End-of-Year
Split Share
Price**
End-of-Year
Actual
Closing
Price
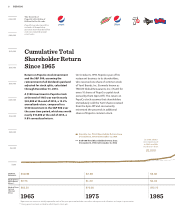
$510 M $2.3 B $8.1 B
$0.75 $1.30 $4.04
$81.50 $70.50
1975 19851965
$72.75
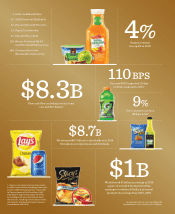
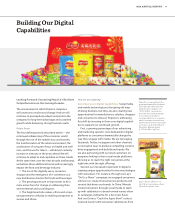
BRAND
2 PEPSICO
The Growth of
PepsiCo’s Portfolio of
Billion Dollar Brands
PepsiCo’s product portfolio
includes 22 brands that
generate more than $1 billion
each in estimated annual
retail sales.
Cumulative Total
Shareholder Return
Since 1965
Return on PepsiCo stock investment
and the S&P 500, assuming the
reinvestment of all dividends paid and
adjusted for stock splits, calculated
through December 31, 2014.
A $100 investment in PepsiCo stock
at the end of 1965 was worth nearly
$43,000 at the end of 2014, a 13.2%
annualized return, compared to a
$100investment in the S&P 500 over
the same time period, which was worth
nearly $10,000 at the end of 2014, a
9.8%annualized return.
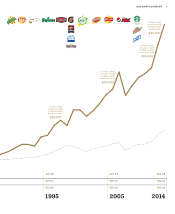
On October 6, 1997, PepsiCo spun off its
restaurant business to its shareholders,
who received one share of common stock
of Yum! Brands, Inc. (formerly known as
TRICON Global Restaurants, Inc.) (Yum!) for
every 10 shares of PepsiCo capital stock
owned by them (Spin-Off). This return on
PepsiCo stock assumes that shareholders
immediately sold the Yum! shares received
from the Spin-Off and concurrently
reinvested the proceeds in additional
shares of PepsiCo commonstock.
PepsiCo, Inc. Total Shareholder Return from
December 31, 1965 to December 31, 2014
S&P 500 Total Shareholder Return from
December 31, 1965 to December 31, 2014
In 1986, a $100
investment made
in 1965 would be
worth more than:
$1,000
*Represents net revenue as initially reported for each of the years presented and does not reect subsequent reclassications or changes in presentation.
**Closing prices have been restated to reect PepsiCo stock splits.